


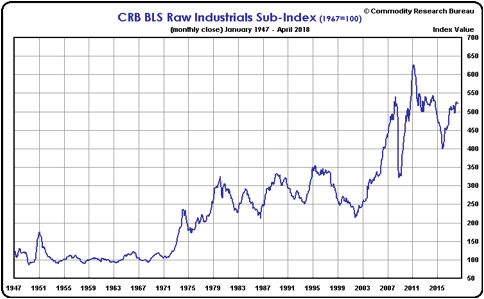
For sure there is a definite shift and turning point in the markets. There is little doubt now, commodities have started a new bull market. The BLS Raw Industrial Index is now up 31% from the 2015 low and will soon be testing long term resistance around 545. A break above 550 will mean a test of the 2011 high will be in order. The chart is to the end of April; on June 4th the index was at 522.37, so little changed.
Nickel prices are on the move from $6 per pound to $7 in the past 60 days and up from $4 a year ago. No sense pussy footing around, the U.S. tariffs on steel and aluminum have intensified a trade war that had already begun. The one thing for certain in trade wars is higher prices, and this alone ensures a break in the index above 550.
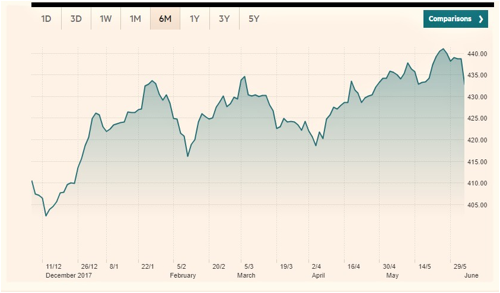
The CRB Index that I give less credibility is also starting to confirm with the recent move above 440, a 3 ½ year high and up 22% from the 2016 low. Since the index went to a black box algorithm in 2005, it increases weights in commodities falling in price and lowers weighting in those that are rising. It has proven to understate commodity inflation. The old CRB data is no longer available, hence my use of the Raw Industrials index for longer-term comparisons.
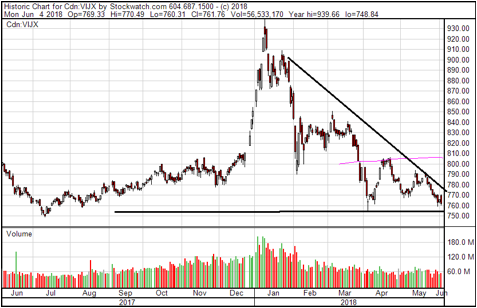
With the TSX Venture index, I pointed out the reversal of early April, but also expected a retest of this low that has now occurred. The down trend is obvious, but I am expecting this low to hold. In other words, I do not want to see a lower low.
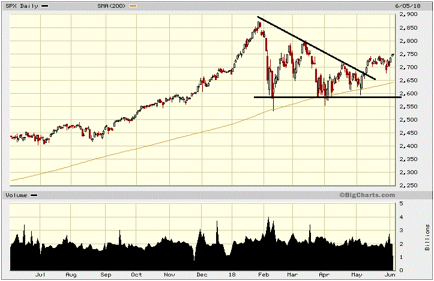
My update on the S&P 500 in early April involved a concern if the market would hold at support around 2580. If it did not, down side was to 2450 and if support held we would need to see a higher high over 2800 for the bull market to have a chance to continue. As you can see below, support held and the down trend has been broken. We are now headed to 2800 and if we go higher, I will be watching for a double top or a break to new highs. There has been good support built around 260 and with plenty of uncertainty abound, I expect we are going to be in a sideways market between 2600 and 2900 for the next several months.
This chart from Bloomberg is quite alarming. What has this smart money alarmed? Certainly some of the items I have mentioned above and further on in this report.
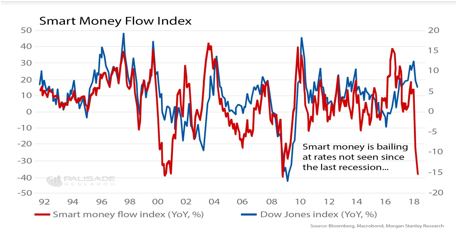
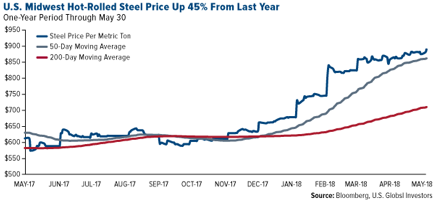
There are cracks appearing in the economic foundation. Delinquency rates on subprime auto loans are now higher than the financial crisis. The 25-year mortgage rate is at 7-year highs and will soon influence the real estate market. U.S. retail sales have been weak this year, averaging only 0.225% growth in the past four months. The good Trump did for the economy by cutting taxes could be undone by tariffs. Steel prices were already up 45% before the tariffs.
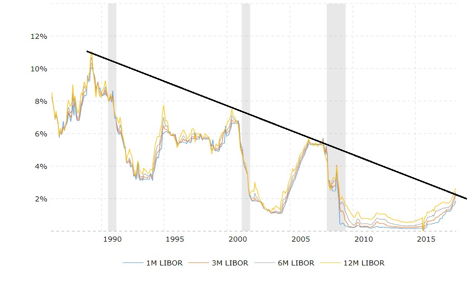
I will be keeping a close eye on economic indicators in the coming months. Again I want to highlight this chart on LIBOR rates I used in early April. Each economic cycle, more debt is piled on and each cycle, rates do not have to rise as much to start the next recession. Drawing a trend line it is easy to see that we are probably already approaching the peak in this cycle with a looming recession.
Sooner or later the gold price will react to higher inflationary pressures, but near term, the price is focused on next week's FOMC meeting and rate hike. I believe the Fed will be limited to just one or two more hikes and next week's increase will probably come with a dovish stance. The gold price often rallies after the Fed hike announcement and is set up for another recurrence. Thus far the rally in the US$ index has been retained by resistance in the 95 area. Weakness on the economic front would probably push the index back down.
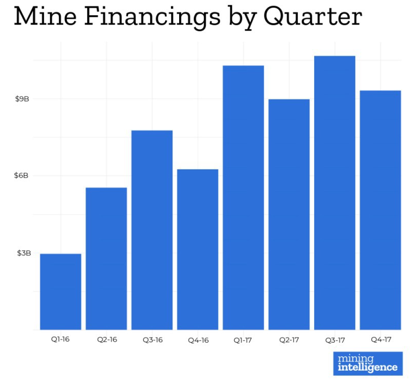
Regardless of the poor outlook we see on the indexes of the miners, the big and so called smarter money that is pouring out of general equities, a chunk is finding a path into the mining sector. Global mining exploration is expected to increase 15% to 20% year-over-year. In Canada the exploration spend has grown 37% in the last two years, and total exploration spend in 2018 is forecast at $2.2 billion.
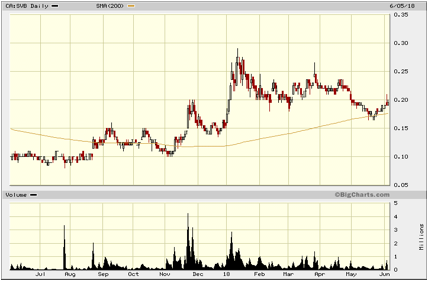
There will be lots of developments with our resource based picks and I expect a substantial rally in the second half of the year. Huge news with Silver Bull Resources on Monday is an example of money coming into exploration. Silver Bull announced a US$100 million JV with mining giant South32, which must spend that amount to earn 70% in the Sierra Mojado project, Mexico.
Silver Bull Resources Inc. (SVB:TSX; SVBL:NYSE.MKT), Recent Price $0.19
Entry price $0.12, Opinion: Strong Buy
South32 is a globally diversified mining company with high-quality operations that mine and produce silver, zinc, lead, nickel, bauxite, alumina, aluminum, energy and metallurgical coal, and manganese. It currently operates in Australia, Southern Africa and South America and are valued with a market capitalization of approximately US$13 billion.
To earn its 70% option, South32 must contribute minimum exploration funding of US$10 million in the first four years with at least $3 million in year one. South32 may exercise its option at any time to buy 70% of Minera Metalin (Silver Bull's Mexican subsidiary) by contributing US$100 million, less an amount of the initial funding contributed by South32 during the option period. Once $100 million has been spent both parties will revert to funding its portion of project. Should South32 elect not to continue with the project at any point during the initial four-year option period, the project will return 100% to Silver Bull.
The exploration program planned for the first year, planned to start immediately, will involve a regional airborne electromagnetic over areas of interest followed by a targeted drilling program on the property. Initial targets will include extension of the sulphide zones recently identified by Silver Bull and Palomas Negros. The exploration program will initially be managed by Silver Bull.
Sierra Mojada already has a 43-101 open pittable oxide deposit containing 90.3 million ounces silver and 4.57 billion pounds of zinc. Judging by all the drilling and channel sampling, it appears the sulphide deposit could end up being much larger and probably have better metallurgy. I am sure it is this potential and the very high grades of silver and zinc that has attracted South32 to commit up to $100 million to get a piece of the action.
The likes of these two holes announced March 14th:
- Hole T17023: 10 meters at 347 grams per tonne silver, 20.7% zinc, 1.25% copper and 1.35% lead;
- Hole T17024: three meters at 303 g/t silver, 20.1% zinc, 1.53% copper and 1.18% lead
A continuous underground channel sampling program announced Sept. 11, 2017, identified a series of east-west-trending high-angle structure-hosting sulphide mineralization. Results from the continuous channel sampling program yielded 31.5 meters grading at 22.36% zinc, 134.5 g/t silver, 2.05% lead, 0.21% copper.
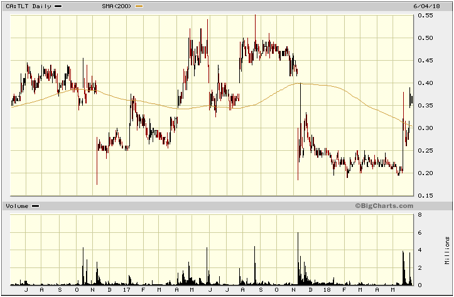
The stock did not react much to this news and exemplifies the doldrums in the current junior market. There is a lot of over head resistance between 20 and 25 cents and I doubt the stock can break through that until market conditions improve or its drill program gets started in the next few months.
Redzone Resources Ltd. (REZ:TSX.V; REZZF:OTC) Recent Price $0.28
Entry Price $0.23, Opinion: Buy on Weakness
In my April 27 update I was concerned with a weak market and 16 cent paper about to come free trading. The risk was a drop below $0.20 and the stock did trade at some lows several days of 18 and 19 cents. I hope some of you were able to pick up the bargain because there was really not a lot of selling pressure and volumes were not that high.
I believe the low is in and the company should start a trenching program any time now, when permits are received. For now I would try bids below the market and pick up shares on any weakness.
Granada Gold Mine (GGM:TSX.V; GBBFF:OTCPK; B6D:FSE), Recent Price $0.21
Entry Price $0.24, Opinion: Buy
As I pointed out in April, with 1.6 million ounces M&I gold, this stock was cheap and it is a little cheaper now. Granada completed an initial trench program at its Aukeko property, immediately adjacent to its flagship gold property, the Granada mine, in the province of Quebec, Canada. A historical bulk sample in this area averaged 7 opt gold, but that was probably on the vein. It will be interesting to see average grades over longer lengths.
Two trenches have been completed, totalling 300 meters in length with a width of around 1.5 meters (trench 1 of 90m length and trench 2 of 210m length). The main goal of the trenching program is to intersect the east-west extension of the extended LONG Bars zone of gold mineralization and to prepare targets for the upcoming diamond drilling program.
"This trenching program is a substantive advance for Granada in shaping management's understanding of our resource. The results of the trenches' samples will be used as a guide for the next step of the exploration to capture the unexplored eastern extension of the mineralized structures, also called the LONG Bars zone," stated Frank J. Basa, PEng, president and chief executive officer of Granada Gold Mine
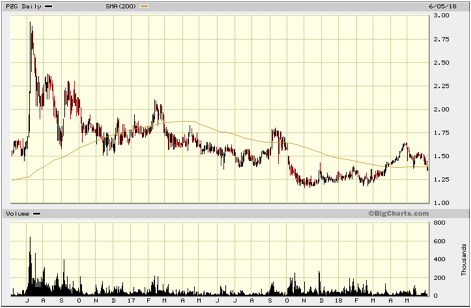
Paramount Gold and Silver Corp. (PZG:NYSE.MKT; PZG:TSX) Recent Price US$1.38
Entry price $1.30, Opinion: Buy
Paramount only has 23 million shares outstanding with just over US$5 million in cash. It is valued really cheap for a M&I resource of 5.3 million AuEq ounces, which is less than $5 per ounce in the ground. What I like about Paramount is its high-grade Grassy Mountain project in Oregon can go to production soon and provide strong cash flow, while its lower-grade Sleeper project in Nevada provides leverage to higher gold prices.
Paramount just released a prefeasibility study that shows head grades to the mill at 7 g/t gold and a low capex of $110 million with low production costs.
Highlights of the PFS are as follows:
- Measured plus indicated resource containing 1.06 million ounces of Au at 0.034 opt (1.17 g/t) plus 3.3 million ounces of Ag at 0.107 opt (3.67 g/t);
- Proven and Probable Reserves containing 362,000 ounces of Au at 0.21 opt (7.20 g/t) plus 516,000 ounces of Ag at 0.30 opt (10.3 g/t);
- Average mill head grade of 0.206 opt of Au (7.06 g/t) and 0.29 opt of Ag (9.94 g/t);
- Cash operating costs of $528 per ounce gold;
- Total costs of $853 per ounce gold produced including all capitalization
- Total operating cash flows of $254 million;
- After-tax IRR of 27.6% and NPV(5%) of $87.8 million at the base case metal prices;
- Annual production of approximately 47,000 ounces of gold and 50,000 ounces of silver for 7.25 years;
- Initial infrastructure capital expenditures of $69.9 million for a 750 ton per day mine and milling operation;
- Total initial capital costs of $110 million including $12.2 million in mine development and pre-production costs, $13.6 million in owners and working capital and $14.2 million in contingencies; and
- Pay back of 2.5 years from the start of production.
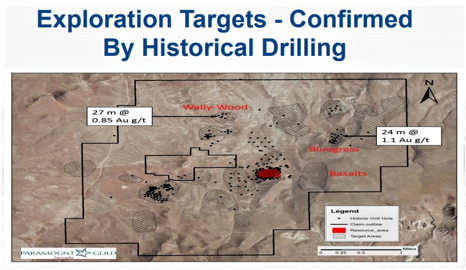
Considering time for permitting, this project could be producing in 2020. While Paramount is advancing on the permitting front, it plans on more exploration that could increase mine life and improve the feasibility. As the map below shows, the exploration targets are confirmed by historical drilling so expanding resources should not be difficult.
The chart shows a long and solid base built around $1.25 to $1.30 area, then a rally to about $1.65. The current pull back to the top of the base and 200 Day MA provides an attractive buy price.
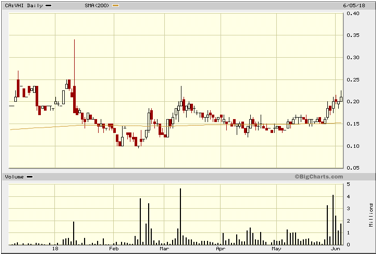
This is one of our tech stocks, but it has broken out on the chart, so a quick update.
VitalHub Corp. (VHI:TSX.V), Recent Price $0.21
Entry Price: $0.16, Opinion: Buy
Interest and volume has been picking up since May 8th when it announced a marketing agreement with Ernst & Young for VHI's WellLinc, a blockchain interoperability solution targeting the mental health and long-term care space.
Vitalhub and EY Canada's health practice have formally agreed to work together on a co-marketing initiative to bring WellLinc to market on a global basis. Vitalhub's WellLinc solution uses blockchain technology to enable the secure and interoperable exchange of electronic health data, across the continuum of care. Some of the potential benefits derived from WellLinc include increased access to health information, leading to improved quality and appropriateness of care, which could lead to better overall health outcomes, and lowered costs in the delivery of care.
Last week, on May 31, Vitalhub made the first sale of WellLinc, the company's proprietary blockchain electronic health record (EHR) interoperability solution. WellLinc has been licensed by Bluewater Health and the Canadian Mental Health Association of Lambton-Kent (CMHA LK).
Upon the successful implementation of the WellLinc blockchain-as-a-service (BaaS) offering, both organizations will license the solution, which provides mental health and long-term care organizations with access to a secured, distributed client record that enables the interoperable exchange of critical patient health data across the continuum of care. Vitalhub's WellLinc solution is built utilizing the hyperledger fabric technology to support full interoperability that is not limited to read-only access to data. WellLinc allows organizations that update a client record in one node to automatically record that transaction and update it across all other trusted nodes.
The company's acquisition and growth strategy is starting to bear fruit, as Q1 2018 revenue came in at $2,923,390, up over 2,000% from a year ago and it basically broke even for the quarter. The stock only started trading some volume in February and since my alert in early March and report in April there was lots of opportunity to buy around 16 cents. We are still not far off these levels and if this uptrend continues, the stock should move into a new higher trading range.
For 27 years, Ron Struthers, founder and editor of Struthers' Resource Stock Report and Playstocks.net, has consistently beat the comparable benchmarks selecting stocks in the precious metals, oil and gas, clean-tech and disruptive technology sectors. In 2017, 35 stocks in the precious metals sector saw an average gain of 62% and energy clean-tech an average gain of 65%. In disruptive technology, 16 picks saw an average gain of 55%. Past performance is no guarantee of future gains. Struthers leverages his vast network of contacts, approaches investments from a value perspective seeking several 100% gain potential and uses technical analysis to aid in buy and sell levels.
Read what other experts are saying about:
Want to read more Streetwise Reports articles like this? Sign up for our free e-newsletter, and you'll learn when new articles have been published. To see a list of recent articles and interviews with industry analysts and commentators, visit our Streetwise Interviews page.
(c) Copyright 2018, Struther's Resource Stock ReportAll forecasts and recommendations are based on opinion. Markets change direction with consensus beliefs, which may change at any time and without notice. The author/publisher of this publication has taken every precaution to provide the most accurate information possible. The information & data were obtained from sources believed to be reliable, but because the information & data source are beyond the author's control, no representation or guarantee is made that it is complete or accurate. The reader accepts information on the condition that errors or omissions shall not be made the basis for any claim, demand or cause for action. Because of the ever-changing nature of information & statistics the author/publisher strongly encourages the reader to communicate directly with the company and/or with their personal investment adviser to obtain up to date information. Past results are not necessarily indicative of future results. Any statements non-factual in nature constitute only current opinions, which are subject to change. The author/publisher may or may not have a position in the securities and/or options relating thereto, & may make purchases and/or sales of these securities relating thereto from time to time in the open market or otherwise. Neither the information, nor opinions expressed, shall be construed as a solicitation to buy or sell any stock, futures or options contract mentioned herein. The author/publisher of this letter is not a qualified financial adviser & is not acting as such in this publication.
Disclosure:
1) Ron Struthers: I, or members of my immediate household or family, own shares of the following companies mentioned in this article: Redzone, Paramount Gold and Silver and Silver Bull Resources. I personally am, or members of my immediate household or family are, paid by the following companies mentioned in this article: None. My company has a financial relationship with the following companies mentioned in this article: Redzone, Silver Bull Resources and VitalHub are advertisers on playstocks.net. I determined which companies would be included in this article based on my research and understanding of the sector.
2) The following companies mentioned in this article are billboard sponsors of Streetwise Reports: Silver Bull Resources. Click here for important disclosures about sponsor fees. As of the date of this article, an affiliate of Streetwise Reports has a consulting relationship with Silver Bull. Please click here for more information.
3) Statements and opinions expressed are the opinions of the author and not of Streetwise Reports or its officers. The author is wholly responsible for the validity of the statements. The author was not paid by Streetwise Reports for this article. Streetwise Reports was not paid by the author to publish or syndicate this article. The information provided above is for informational purposes only and is not a recommendation to buy or sell any security. Streetwise Reports requires contributing authors to disclose any shareholdings in, or economic relationships with, companies that they write about. Streetwise Reports relies upon the authors to accurately provide this information and Streetwise Reports has no means of verifying its accuracy.
4) This article does not constitute investment advice. Each reader is encouraged to consult with his or her individual financial professional and any action a reader takes as a result of information presented here is his or her own responsibility. By opening this page, each reader accepts and agrees to Streetwise Reports' terms of use and full legal disclaimer. This article is not a solicitation for investment. Streetwise Reports does not render general or specific investment advice and the information on Streetwise Reports should not be considered a recommendation to buy or sell any security. Streetwise Reports does not endorse or recommend the business, products, services or securities of any company mentioned on Streetwise Reports.
5) From time to time, Streetwise Reports LLC and its directors, officers, employees or members of their families, as well as persons interviewed for articles and interviews on the site, may have a long or short position in securities mentioned. Directors, officers, employees or members of their immediate families are prohibited from making purchases and/or sales of those securities in the open market or otherwise from the time of the interview or the decision to write an article, until one week after the publication of the interview or article. As of the date of this article, officers and/or employees of Streetwise Reports LLC (including members of their household) own securities of Redzone and Silver Bull Resources, companies mentioned in this article.
Charts and graphics provided by the author.


