


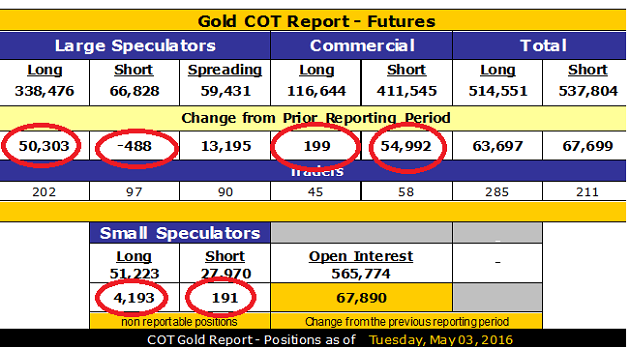
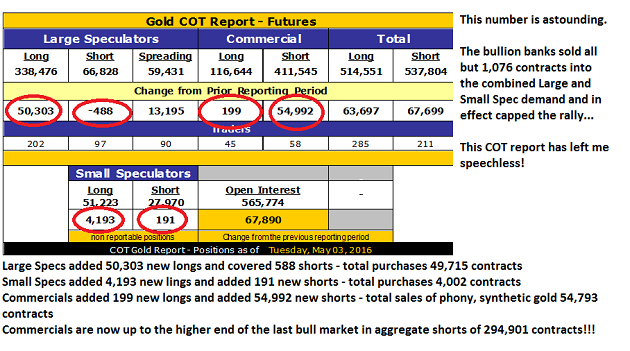
Just as investors around the globe have finally concluded that all forms of "fiduciary" does not revolve around AAPL, NFLX or AMZN, instead pouring trillions of dollars into the physical gold and silver markets and billions into gold and the gold miners (with the tap of a computer key and absent any type of regulatory scrutiny), the bullion bank behemoths feathered out nearly 55,000 contracts during the last COT week, representing 55,000,000 ounces of phony, synthetic, gilded "supply." With the exception of a measly 1,076 contracts representing a little over 2% of demand during that reporting period, the Commercials filled 98% of the Large and Small Spec demand with nary a tad of consternation or concern over any type of squeeze orGod forbidcensure.
I refuse to get all worked into a lather over this as there are some important takeaways:
1. 294,901 net shorts representing 29,490,100 ounces is 836 tonnes, 71 metric tonnes greater than the reserves held by the Bank of Japan; that is a mammoth amount of gold to be "bought back" or at least removed from current supply.
2. Despite this incredible price-capping development, the HUI (NYSE.Arca Gold BUGS Index) is a mere 4.12% off the 2016 high.
3. The silver COT (Commitment of Traders Report) showed an improvement with the Commercials covering around 700 shorts.
When I read the number at 3:30 p.m., I just about fell out of my chair, but I recovered quickly enough to resume my study of the numbers. What snapped my head back was that 294,901 aggregate shorts put on by this collusive cabal of criminals is now at extremes not seen since 20102011, including the big week in August 2011 when gold blew through $1,900/oz and put in THE top.
However, the difference between 2011 and 2016 is that the extremes seen in late 2011 punctuated a 10-year bull move from $252/oz.; bullish consensus was stretched with many other conditions pointing to a top. Contrast that with the age of the current bull market, which I contend began in early December of 2015, and what you get is a market that is a mere FIVE MONTHS old and a vast majority of traders anchored in the memories of the 20112015 bear market and the horror of that ignominious era. Look at the chart below that has a large green line that represents the extreme levels of commercial shorting dating back to 2008 (the "Financial Crisis").
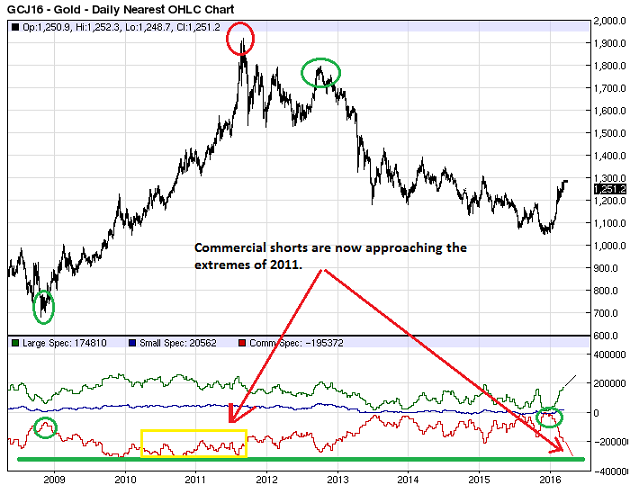
What smacks you clearly in the face is that it took from 1999 at $252 until August 201112 yearsto get to the -280,000 commercial net short position and only five months to unwind it, which begs the question: Why have the banks, which allegedly represent the senior gold miners, been reporting such immense increases in "hedging activity"? Well, many of my friends are senior executives with major GOLD mining companies (Truth be known? They are either now-retired senior executives or their CHILDREN because I am SO getting older) tell me that in recent discussions with the CFOs, hedging is generally NOT on the table. With the big gold miners, $1,500-plus would be tempting but $1,260? Not so much. However, where it certainly IS on-the-table is in the major base metal miners, as in the case of BHP Billiton, where it has a 25% gold component to a massive copper-gold porphyry, which is now bleeding profusely with the main copper operation, so just to "make the number" they "cash credit" the gold byproduct (which should truly be a "COproduct") in order to keep their jobs.
Now, whose idea would that have been? The CFO (Chief Financial Officer) of BHP? The CHO (Chief Hedging Officer) of Rio Tinto? The CMMNO (Chief "Make-My-Number -Officer") of Codelco? Ahhhhhh, I really don't think so. I think it is a 30-something junior analyst at "JP Morgan, Cayman Islands" that has an advanced mathematics degree from Moscow U. whose oligarch father bribed his way into Boca Raton and has $2 billion in AUM at JPM Private Wealth. Young Sergei has a profit target to meet for the quarter, so he decides to go to the hedging arm of their futures operation to execute a prop desk trade under the guise of a "hedge" where his hedge margins are fraction of normal speculative margins. This means that he has unlimited shorting power despite a market that has moved over $250/ounce against him since the lows of early December, which coincidently marked the upturn from -2,911 figure during the first week of December.
Think about it. In four "COT weeks," the gold price has gone from $230 to $290 during which the cretins have sold over 88,000 contracts or 8,800,000 synthetic "ounces" of paper gold, so assume an average of $260 as a price point and a weekly close of $295 representing paper loss of $308,000,000 since May 3. Now pick an average sale price of, say, $1,230 on the early paper gold sales from Dec. 4 until May 3 on the remaining net shorts (207,245 2,911) 207,334, and multiple by $65/oz loss and you have an additional paper loss of $1,328,171,000 and $1,634,171,000 of losses accrued since that historic day last December when Commercials were actually net long for the first time since 1999 at $252.80/oz. Now granted that there could be a great deal of spreading within COT activity as the cretins could easily have used swaps or options to offset futures exposure, but any way one cuts it, someone is "out" some serious capital. If I were a gambling man (please don't roll your eyes), I would say that the odds favor minimal producer hedging in favor of raw speculation by the banks secured by implicit but unofficial guarantees by the central bank snapperheads. Will they be forced to cover?
Here we are five months into the New Golden Bull and putting it mildly, 2016 has to go into the record books for a couple of reasons. The first reason is that I have NEVER in my 38-year career witnessed a rally out of a bear market that comes close to the one in which we have found ourselves. The second reason is that everyone and their brothers have drastically reduced their exposure to gold, especially those that were adequately positioned back in December when I brilliantly/luckily/drunkenly identified the bear market low in early December.
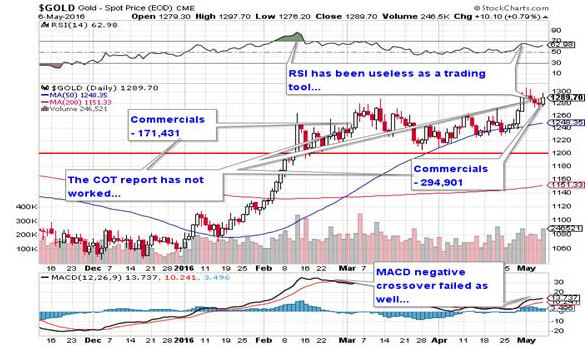
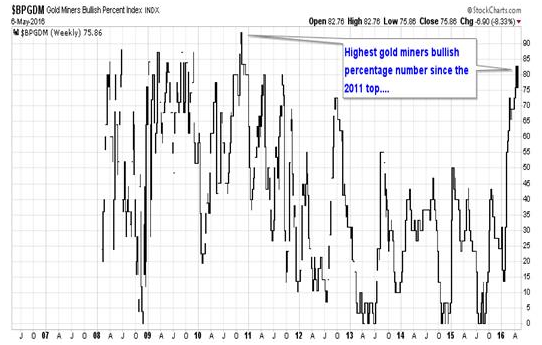
This weekend there abounds a plethora of articles calling for a correction and more than a few that are calling for a major top citing sentiment numbers, bullish percentage figures, RSI (Relative Strength Index), MACD (Moving Average Convergence Divergence), and of course the COT. However, it is only the gray hair in my beard that allows me to recall the first few months of the 19822000 Great Bull Market in stocks, and I can tell you that stocks got overbought and stayed overbought from August 1982 until March 1983 before they corrected.
For the gold miners, we are now in month four of the advance of the Jan. 19 low and for those out there trying to time the correction, nothing has yet worked that had been working before. The COT worked beautifully in October with the Commercials short 166,000 followed by a $150 drop; we got to 171,431 back in on March 1 with gold at $1,230 followed by a $76 ADVANCE and a 123,470 INCREASE in commercial shortsso the COT hasn't worked. RSI has been as high as 86.75 on Feb. 11 with gold at $1,245; it dropped under 50 briefly on a move to $1,210 and has since not made it back to 70 despite a move in price to $1,306, so RSI hasn't worked. MACD has had one negative crossover and two near misses since February while the Histograms have gone from plus to minus to plus with the worst print in since February at $1,210. Bullish percentage has an 83 print and is the highest BPI for gold miners since the top in August 2011. Nothing in the annals of technical analysis has worked for one simple reason: We are in a BULL MARKET.
I spoke to a friend who has traded blue chips for 40 years with of the big banks last Friday; he said "This is insanity. It's all about the algo-bots being programmed to be trend-following cyber-machines and they don't care about valuations." What I took away from that conversation is that as stupidly undervalued as the HUI got all last year until Jan. 19 of this year, it didn't change until the "bots" started to trend-follow the gold miners, and that includes the GLD (SPDR Gold Trust). What that means is that gold inflow from the momo-worshipping "bots" inhaling the GLD is now pitted against the Commercials insatiable desire to satisfy "bot" demand. And it looks as though this Ali-Frazier slugfest won't end any time soon.
So how do you play it without losing your positions? Well, exactly how I have beenyou take the GDXJ (Market Vectors Junior Gold Miners ETF) where you own 1,000 shares; when it hit $30, you were ahead roughly $11 per share. When the Commercials blew through 171,000 shorts, if you bought 10 puts of the GLD May $30 puts for $2.30, you spent $2,300. Last week GDXJ hit $39 so you gained $9,000 in equity but gave up $2,300 in hedge costs. You STILL OWN your GDXJ and you have been sleeping just fine, thank you.
With all of these indicators flashing warning signs and despite their ineffectiveness until now, you must remain protected by way of limited-risk hedges. That's the only sensible way to invest in a market that is being driven by pattern-recognition technology, a technology that can turn in a nanosecond and move the market from up 4% to down 7% in the time it takes for a trade to travel via microwave signal 790 miles from the Crimex in Chicago to 33 Liberty St. in NYC.
The second reason that hedges are imperative is state of mind. I have discovered an inverse relationship between the size and scope of mining position hedges and liquor cabinet and medicine chest inventories coupled with a direct correlation between hedge position abandonment and nasty dog bites and extremely cold shoulders from spouses, bank managers and clients. It is my guarded advice that for your senior and intermediate miners, you get hedged and you STAY hedged until those indicators mentioned above come back into line again.
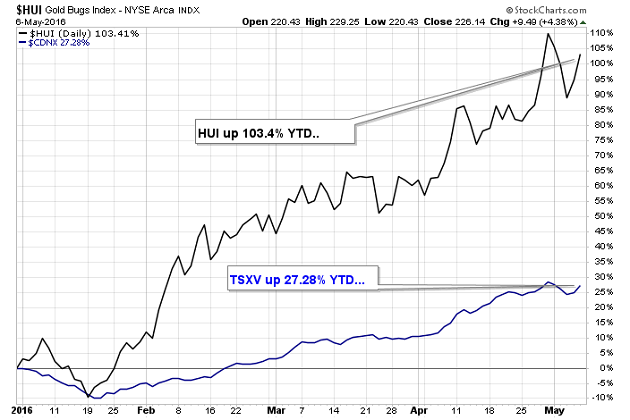
Lastly, the micro-cap explorer/developer group that usually reside on the TSX Venture Exchange has advanced 27.28% YTD versus the seniors represented by the HUI up 103.4% YTD, begging the question, "Is there a "catch-up" trade in the little guys?" and the answer is categorically "Absolutely." In late 2014, I put out a disastrously ill-timed collection that I affectionately called "The Scurvy-Ridden Bilge Rats" in reference to just how reviled the sector was back then. Being about 15 months early was not exactly one of the more stellar ideas I have ever had, as only two of the five recommended companies has worked out. Nevertheless, it is with great pleasure (and even greater apprehension) that I am offering my new list that actually will continue to include Tinka Resources Ltd. (TK:TSX.V; TLD:FSE; TKRFF:OTCPK) and Kaminak Gold Corp. (KAM:TSX.V) despite the fact that Kaminak has advanced from $0.77 to $2.04 in that period. This time, however, I am going to diversify the list by disintoxicating it with more silver than gold and with a bigger developer component. I am also renaming the "rats" to reflect their new exalted status as outperformers; the new list will be called "The '357 Magnum" in reference to its potential to change lives.
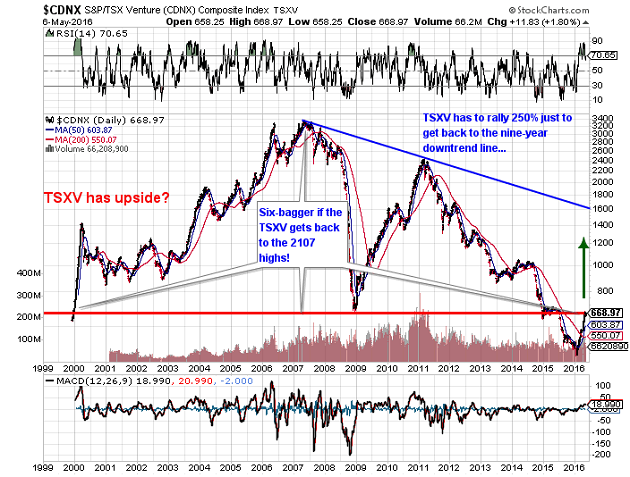
My thesis is that the seniors and intermediates found in the HUI have received the initial new-bull-market ourpouring of love from investors and that outpouring began on Jan. 19 with the TSX.V not actually going positive on the year until Feb. 20, at which point the HUI was already galloping ahead 35%. So while the TSX.V is now up 43.5% off the lows, it really only kicked into gear in early March. The PDAC "Curse," which has been a reliable indicator since the 1990s has failed to have put as much as a scratch to the flanks of this bovine beast, making the TSX.V a cheaper entry level if one is late to the partyand there are a lot of people that are not only late but they haven't even called a cab yet.
Correction or not, 2016 is moving rapidly toward the history books in terms of gold price ascent and performance relative to the S&P, and while I have no doubt that a correction is coming, that chart of the TSX.V is telling me that there is still a lot of room left. If the Commercials' heat fails to spook the hedgies and is brushed off by the miners, then we will have to move quickly to own the "cream" of the "penny dreadfuls" before they decide to own US. . .
Originally trained during the inflationary 1970s, Michael Ballanger is a graduate of Saint Louis University where he earned a Bachelor of Science in finance and a Bachelor of Art in marketing before completing post-graduate work at the Wharton School of Finance. With more than 30 years of experience as a junior mining and exploration specialist, as well as a solid background in corporate finance, Ballanger's adherence to the concept of "Hard Assets" allows him to focus the practice on selecting opportunities in the global resource sector with emphasis on the precious metals exploration and development sector. Ballanger takes great pleasure in visiting mineral properties around the globe in the never-ending hunt for early-stage opportunities.
Want to read more Gold Report articles like this? Sign up for our free e-newsletter, and you'll learn when new articles have been published. To see a list of recent interviews with industry analysts and commentators, visit our Streetwise Interviews page.
Disclosure:
1) The following companies mentioned in the interview are sponsors/billboard advertisers/special situations clients of Streetwise Reports: None. The companies mentioned in this interview were not involved in any aspect of the interview preparation or post-interview editing so the expert could speak independently about the sector. Streetwise Reports does not accept stock in exchange for its services. The information provided above is for informational purposes only and is not a recommendation to buy or sell any security.
2) Michael Ballanger: I or my family own shares of the following companies mentioned in this interview: Kaminak and Tinka. I personally am or my family is paid by the following companies mentioned in this interview: None. My company has a financial relationship with the following companies mentioned in this interview: None. I determined which companies would be included in this article based on my research and understanding of the sector. Statement and opinions expressed are the opinions of Michael Ballanger and not of Streetwise Reports or its officers. Michael Ballanger is wholly responsible for the validity of the statements. Michael Ballanger was not paid by Streetwise Reports for this article. Streetwise Reports was not paid by the author to publish or syndicate this article.
3) Interviews are edited for clarity. Streetwise Reports does not make editorial comments or change experts' statements without their consent.
4) The interview does not constitute investment advice. Each reader is encouraged to consult with his or her individual financial professional and any action a reader takes as a result of information presented here is his or her own responsibility. By opening this page, each reader accepts and agrees to Streetwise Reports' terms of use and full legal disclaimer.
5) From time to time, Streetwise Reports LLC and its directors, officers, employees or members of their families, as well as persons interviewed for articles and interviews on the site, may have a long or short position in securities mentioned. Directors, officers, employees or members of their families are prohibited from making purchases and/or sales of those securities in the open market or otherwise during the up-to-four-week interval from the time of the interview until after it publishes.
All charts courtesy of Michael Ballanger


