
We start this update with the latest version of Larry's amazing gold chart. As Larry states
"Gold touched $1683.00 on Friday.
Real close to touching the phantom outside possibility line.
To me this means the final moment of truth should be revealed in the next week.
Huge watershed movement one way or the other is about to happen."
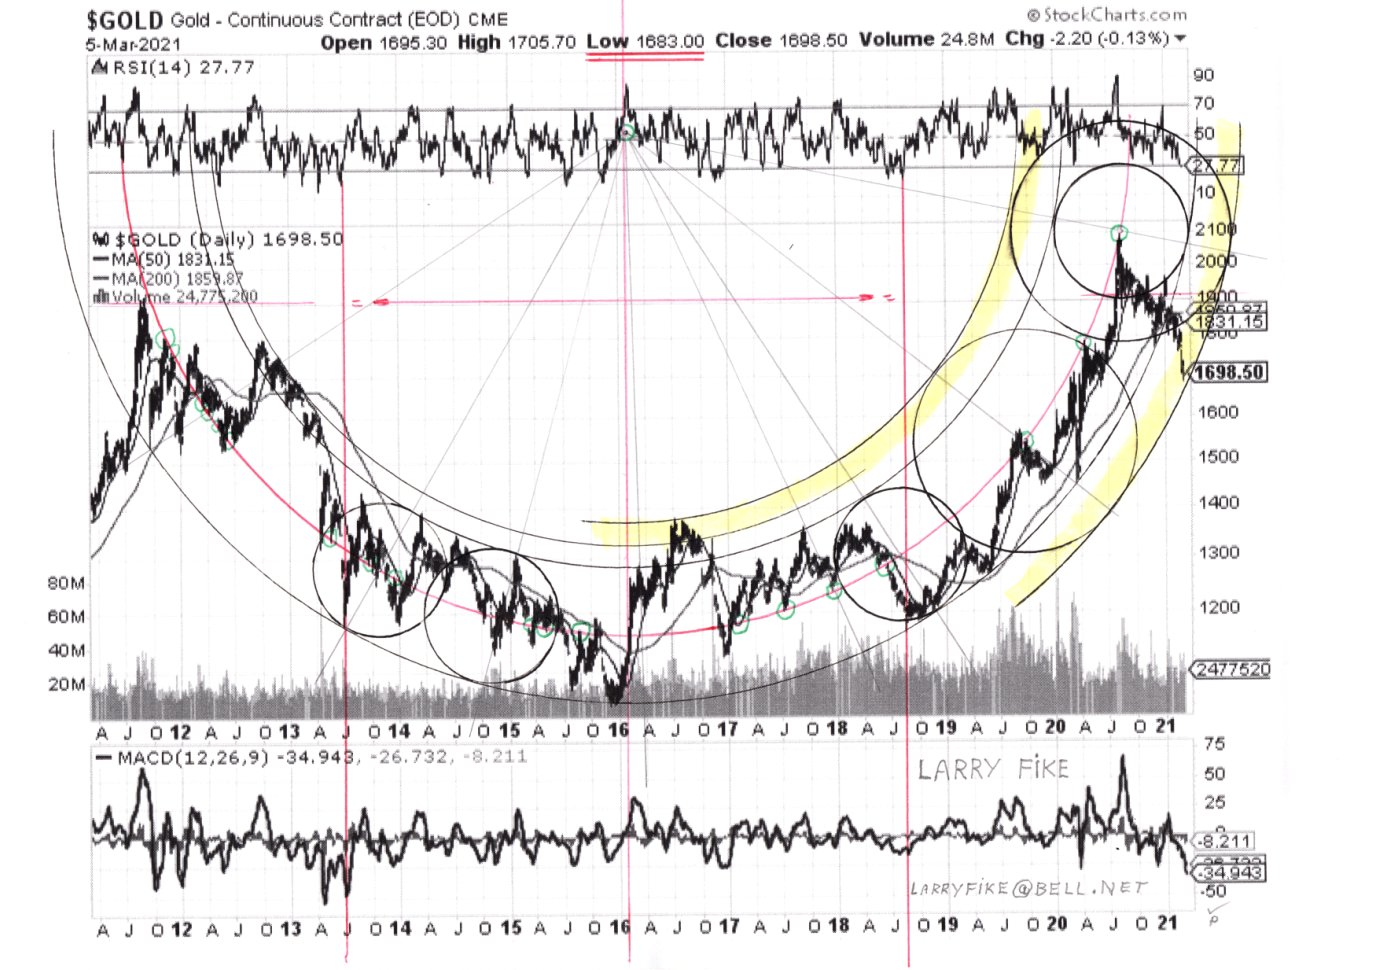
Click on chart to pop up a larger, clearer version.
From the action in gold and across markets on Friday, I believe that gold will reverse to the upside this coming week. What happened on Friday is that, with the markets starting to look really fragile, the Bank of America came riding to the rescue saying that the Fed was "going to exercise yield curve control" or words to that effect, meaning that it will attempt to cap shorter-term yields like the 10-year. Every time since 2008 that the markets have looked like they were going to completely cave in, either the Fed has thrown open the monetary spigots or markets have been bolstered by such rhetoric. Anyway it certainly did the trick and we had a big reversal, with bullish reversal candlesticks appearing all over the place, including in many of our stocks.
A point worth making with respect to Larry's gold chart is that even if gold were to breach the outermost boundary of the giant Bowl pattern, what Larry refers to as the "phantom outside possibility line," it may simply mean that a "Handle" is about to form that would complement the Bowl, making it a giant Cup & Handle pattern. As investors in the sector we would rather not see that as if the Handle that formed was proportional to the Cup, it could drag on for anything from 6 to 18 months. However if f gold takes off higher immediately, as looks likely, the move could be really big.
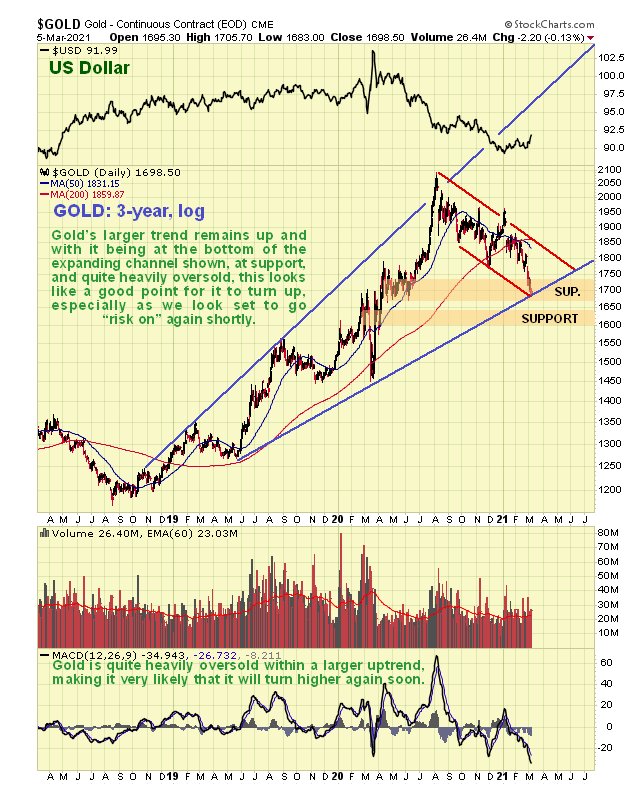
On the 3-year chart we can see gold has reacted all the way back across an expanding channel and now looks like a trading buy for a rally, especially as it is oversold and at an important support level. Bearing in mind what we observed above with respect to it possibly making the Handle of a Cup & Handle pattern, one possibility is that it rallies back up to near the highs of last August and then runs off sideways in a Rectangular pattern bounded by roughly between where it is now and the highs.
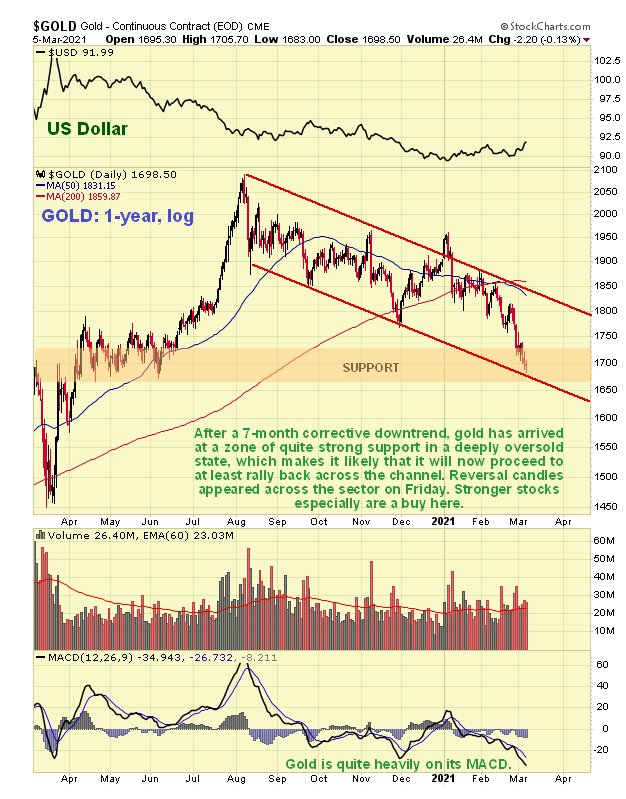
On the 1-year chart we see that not only is gold at the bottom of the expanding channel that we observed on the 3-year chart, it is also at the bottom of the downtrend channel in force from last August, which is double reason for it to turn higher here, quadruple if you factor in that it is significantly oversold and at strong support.
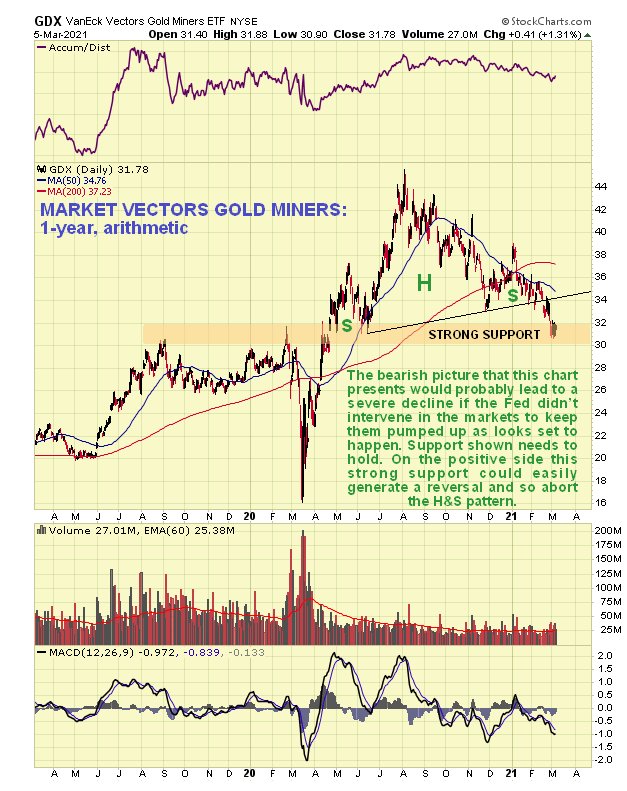
Whilst we know that charts admit of any and all possibilities, and that gold's chart doesn't look too bad, the GDX chart is more concerning as it shows that this ETF may have already broken down from a large Head-and-Shoulders top, which if valid will project it down towards the lows of March last year. For this to happen the broad stock market would probably have to go into "risk off" mode and tank, and that doesn't look likely in the foreseeable future given what happened in the markets on Friday. So there is considered to be a fair chance that this potential H&S top pattern will abort.
The market doesn't care about the economy, that much is already obvious all it cares about is abundant cheap money, and it threw a tantrum last week because the US Treasury 10-year Yield started to rise to levels that are now becoming concerning, as we can see on the 1-year chart for the 10-year Yield below
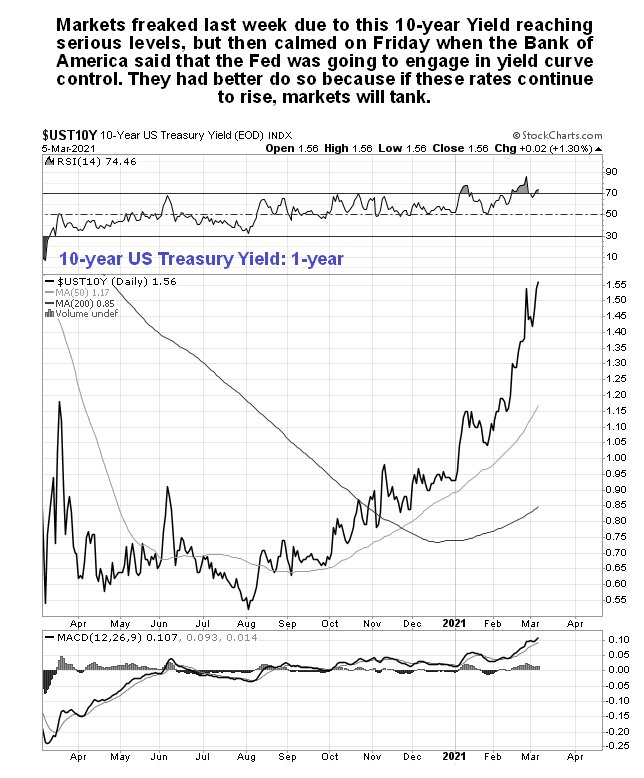
If the 10-year Yield continues any higher it is likely to trigger a much more severe risk-off selloff, so how do stock indices look?
The Dow Jones Industrials doesn't give a clear indication, nor would you expect it to given that it is a narrow index, and you can only just about make out what's going on on the S&P500 index, but the index that really gives the game away is the broad Wilshire 5000 Index. On the 6-month chart for this index we can see that upside momentum (MACD) has been fizzling for months, and also that a potential Head-and-Shoulders top is forming, with a line of important support of about 39,200. Thus, if this index drops below 39,000 it could really tank. The Fed therefore needs to pull out all the stops to prevent this happening, which if past performance is prologue, it will do.
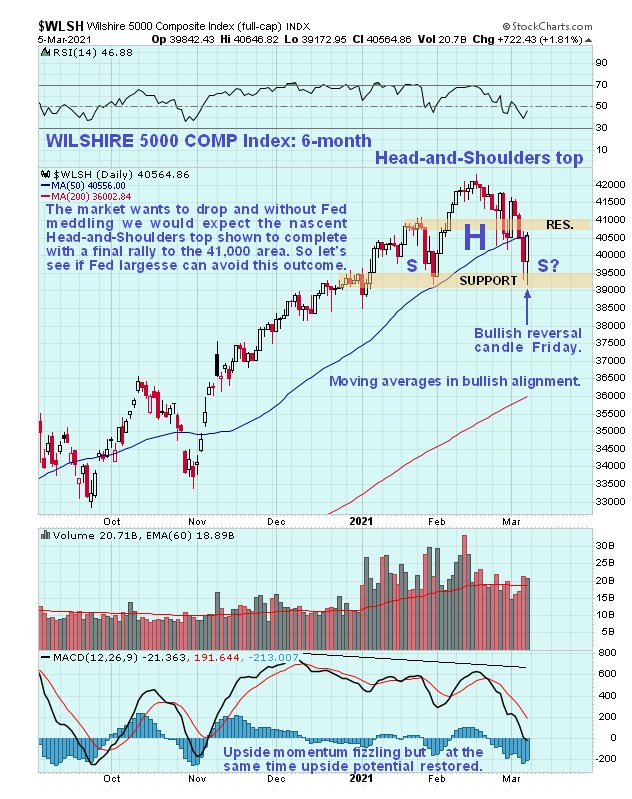
Fortunately, it looks like we have a bit of timethere was reversal candle on Friday in this index, in other indices and in many stocks which implies that another rally is starting, but the danger is that this rally might only be a rally to mark out a symmetrical Right Shoulder to complete the potential Head-and-Shoulders top. So we need to see if the Wilshire can drive through the resistance approaching the highs, especially the resistance at the Left Shoulder of the potential H&S top, which is at about 41,000. If it does and the Fed "delivers the goods," meaning more liquidity, then markets could be "off to the races" again, which this time should be better for the precious metals sector than thus far.
Originally posted on CliveMaund.com on Sunday, March 7, 2021.
Clive Maund has been president of www.clivemaund.com, a successful resource sector website, since its inception in 2003. He has 30 years' experience in technical analysis and has worked for banks, commodity brokers and stockbrokers in the City of London. He holds a Diploma in Technical Analysis from the UK Society of Technical Analysts.
[NLINSERT]Disclosure:
1) Statements and opinions expressed are the opinions of Clive Maund and not of Streetwise Reports or its officers. Clive Maund is wholly responsible for the validity of the statements. Streetwise Reports was not involved in any aspect of the article preparation. Clive Maund was not paid by Streetwise Reports LLC for this article. Streetwise Reports was not paid by the author to publish or syndicate this article.
2) This article does not constitute investment advice. Each reader is encouraged to consult with his or her individual financial professional and any action a reader takes as a result of information presented here is his or her own responsibility. By opening this page, each reader accepts and agrees to Streetwise Reports' terms of use and full legal disclaimer. This article is not a solicitation for investment. Streetwise Reports does not render general or specific investment advice and the information on Streetwise Reports should not be considered a recommendation to buy or sell any security. Streetwise Reports does not endorse or recommend the business, products, services or securities of any company mentioned on Streetwise Reports.
3) From time to time, Streetwise Reports LLC and its directors, officers, employees or members of their families, as well as persons interviewed for articles and interviews on the site, may have a long or short position in securities mentioned. Directors, officers, employees or members of their immediate families are prohibited from making purchases and/or sales of those securities in the open market or otherwise from the time of the decision to publish an article until three business days after the publication of the article. The foregoing prohibition does not apply to articles that in substance only restate previously published company releases.
Charts provided by the author.
CliveMaund.com Disclosure:
The above represents the opinion and analysis of Mr. Maund, based on data available to him, at the time of writing. Mr. Maund's opinions are his own, and are not a recommendation or an offer to buy or sell securities. Mr. Maund is an independent analyst who receives no compensation of any kind from any groups, individuals or corporations mentioned in his reports. As trading and investing in any financial markets may involve serious risk of loss, Mr. Maund recommends that you consult with a qualified investment advisor, one licensed by appropriate regulatory agencies in your legal jurisdiction and do your own due diligence and research when making any kind of a transaction with financial ramifications. Although a qualified and experienced stock market analyst, Clive Maund is not a Registered Securities Advisor. Therefore Mr. Maund's opinions on the market and stocks can only be construed as a solicitation to buy and sell securities when they are subject to the prior approval and endorsement of a Registered Securities Advisor operating in accordance with the appropriate regulations in your area of jurisdiction.