

Summary: In the months since the COVID-19 crash began, stock prices have been on a wild ride in anticipation of a tsunami of poor economic data. However, some investors appear to be seeing the light at the end of the tunnel including McAlinden Research Partners (MRP). While most see a V-shaped recovery as doubtful, we feel that the combination of what appears to be limitless fiscal and monetary stimulus, combined with better than expected reopening data in a number of states, provides compelling reason to expect a V-shaped recovery.
A V or not a V; that is the question. At least for the moment. According to a majority of commentators, the answer is not a V. But MRP is in the distinct minority, still expecting a sharp economic rebound.
This content was delivered to McAlinden Research Partners clients on May 29. To receive all of MRP's insights in your inbox MondayFriday, follow this link for a free 30-day trial.
And now new questions have arisen, in particular, how permanently the effects of the COVID-19 pandemic will affect long-term growth beyond the initial recovery, whatever its shape. Many notable sources have described scenarios of substandard economic growth for years to come irrespective of the shape of the recovery in the short run. Given the vigorous rebound of stock prices globally, the answers to both questions have critical implications for investor decision-making.
Bursting the Cable News Bubble
Even with the S&P 500 closing in on its pre-crash high, many have struggled to let their guard down. While that is understandable, given the slow reopening of many facets of the U.S. economy, the financial media, as always, has their own hands on the reigns of investor sentiment as well. In fact, one could argue that the media is wielding even more power these days amid quarantines, layoff, and office closures that have driven up TV viewership. Per Comcast, the average American household is now watching at least eight hours more per week. In early March 2020, the average household watched 57 hours of content per week. That's now up to 66 hours a week. More to our point, the Comcast data shows an increase of up to 64% in consumption of news programming since the start of COVID-19.
A 2017 study out of New York University, estimating the size of the tilt in financial media coverage found that a greater amount of media coverage foreshadows declines in firms' profitability and negative earnings surprises. The study specifically points out that a news story is approximately 22% more likely to be covered if it is negative.
One example that has been tossed around recently, especially in regard to Europe, is the South Sea Bubble, a 1720 rush for stock in the UK's South Sea Company following the passage of a bill giving the company a monopoly on trade in South America. Long story short, South Sea's stock rose so strongly that bullish sentiment exploded around virtually any publicly traded company. When the price of South Sea finally passed its peak, a liquidity crunch enveloped thousands of investors that had bought their shares on credit and the whole market crashed, taking the English economy with it.
Actual parallels between the COVID crash and the speculation-driven South Sea Bubble are sparse. While the South Sea Bubble was full of inflated valuations with no revenue to back them, most of the gains we've seen in equity prices are accumulating toward blue chips or other high-powered earners with healthy balance sheets. In the NASDAQ Composite, for instance, Barron's recently reported that the index's top 10 largest stocks (a list that includes all of the FAANGs, as well as other power players like Intel, Nvidia, and Cisco) have gained almost $900 billion, triple the sum of the 2,600 other companies.
Ben Bernanke, former Federal Reserve chairman, has warned against any kind of comparison to other crashes, like the Great Depression. In a recent speech to the Brookings Institution, Bernanke noted that the Depression was ultimately triggered by a financial meltdown and made worse by bad policy choices, including the decision by his Fed predecessors to raise interest rates.
Perhaps the most comparable event in modern economic history would be the Spanish flu epidemic of 19181920, a global pandemic that may have resulted in up to 500 million cases and at least 50 million dead. Writing for VoxEu, Carola Frydman, an economic historian at the Kellogg School of Management, alongside professor and finance researcher Efraim Benmelech, recently analyzed the effects of that pandemic, which was countered by "social distancing" measures similar to those we've adopted today. Despite the Spanish flu being unusually deadly for those in their 20s and 30s, the duo wrote that the economic fallout was "mostly modest and temporary," despite an inevitable recession. The rebound of the U.S. economy in the aftermath set the stage for a strong decade of economic growth that followed. Much like today, the stock market recovered substantially amid the pandemic, with the Dow index increasing by 10.5% in 1918 and by 30.5% in 1919.
Why Do We See the V?
None of this is to say that we aren't in very unique territory and very serious concerns about economic growth, corporate earnings, and the overall health of the global population are invalid. But a detailed analysis of available data shows many reasons to feel a bit more optimistic than certain sensationalist "experts" would lead many to believe. That demonstrable bias toward the negative might be part of explaining why just 25% of investors surveyed by Bank of America Merrill Lynch think the latest rally in stocks is part of a new bull market. An even smaller group of just 10% is buying a V-shaped recovery.
While MRP remains cautious of a W-shape in equities, which could follow an inevitable barrage of shocking economic data for the first and second quarters, we remain steadfastly entrenched in the V-shaped camp when it comes to the economic recovery, as we first noted back in March.
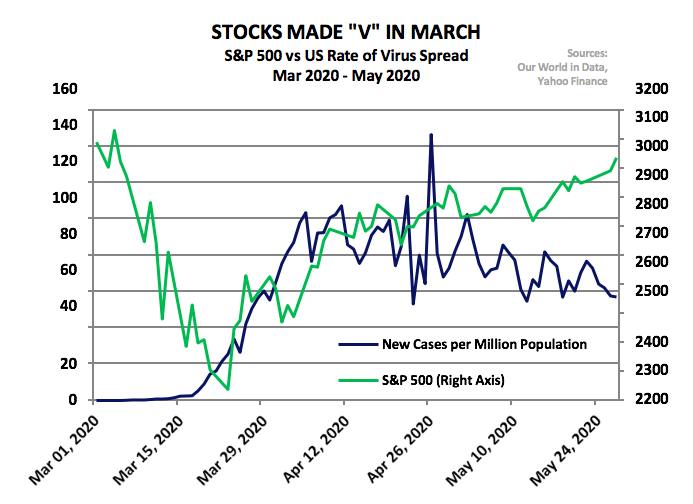
Aside from the aforementioned rebound we've already seen in stock prices, as the S&P 500 has surged 25% since its March trough, V shapes have already been forming in several other corners of the economy.
Data from Redfin showed a "stunning" rebound in housing market activity over the last month, as homebuying demand is now 16.5% above pre-coronavirus levels while home values have seen accelerating growth. Mortgage applications to purchase a home rose 9% last week from the previous week and from a year earlier, according to the Mortgage Bankers Association's seasonally adjusted index. It was the sixth straight week of gains and a 54% recovery since early April.
Though this resurgence has largely been led by existing home sales, particularly among millennials on the hunt for cut-rate mortgages on their first home, demand for housing at these low rates will eventually flow through to the market for new homes as well, especially with an ever-shrinking supply of homes for sale. Supply of homes for sale fell 19.7% year over year (yoy) last month, notching the lowest April inventory figure ever.
Though April housing starts actually dipped to their lowest level, it was also the severest month yet for lockdown and quarantine measures across the country, likely placing holds on construction and other activity related to homebuilders. Despite very rough data from the National Association of Home Builders (NAHB), homebuilder sentiment actually rose 7 points from 30 to 37a modest improvement, but one that could mark the bottom for corona-induced damage to the housing market.
MRP added LONG Homebuilders to our list of themes in March and we believe, when lockdowns ease, tightness in the housing market will begin pushing homebuilders to new highs.
The price of crude oil, as well as gasoline and other refined products are also on the rise after falling into negative territory for the first time ever.
Demand in China, the world's second largest consumer of crude oil, behind the U.S., crashed by about 20% as the country went into lockdown in February. Consumption of gasoline and diesel has fully recovered as factories reopen and commuters drive rather than use public transport. Bloomberg reports that consumption was at about 13 million barrels a day, just shy of the 13.4 million barrels a day of May 2019 and 13.7 million barrels a day of December 2019, led by an uptick in driving among Chinese commuters and travelers, an effort to avoid public transit. Earlier this month, MRP noted that same phenomenon ratcheting up miles driven across Europe and the U.S. as well.
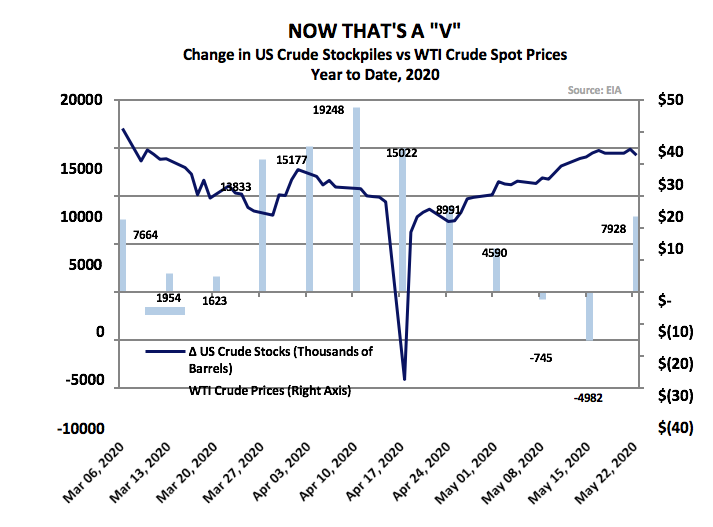
The Wall Street Journal also covered the bullish turn for oil in the U.S. as the pickup in refiner demand to supply Americans getting back on the road has helped West Texas Intermediate's (WTI's) recovery. Pipeline flows from Cushing to Midwestern refiners are 400,000 barrels a day higher than they were in early April, according to commodity-market information provider Genscape. WTI crude prices closed last week out at a 10-week high after the Energy Information Administration (EIA) reported an oil inventory draw of nearly 5 million barrels for the week to May 15. Though this most recent week snapped a two-week decline inventories, output cuts across many U.S. shale fields are just beginning to be picked up in the data.
MRP also initiated LONG Crude Oil and U.S. Energy as a theme last month, on the back of global production cuts by Saudi Arabia and Russia, as part of a broader OPEC+ syndicate, and various non-OPEC producers across Europe and the Americas.
Perhaps the most critical signals of a rebound may be found in broader consumer data.
The preliminary reading of the University of Michigan's consumer-sentiment survey in May edged up to 73.7 from 71.8 in April, beating economists' forecast of a small decline. While the weekly gauge of consumer comfort from Bloomberg has continued to edge down, the latest decline was the smallest since the coronavirus-induced plunge started about a month and a half ago. Like the previous two examples, it looks like peak lockdown in the April-May period will likely coincide with the bottom of these data points.
The latest personal income data, released on Friday, showed a 10.5% surge month over month (mom) in April, the biggest rise on record and beating forecasts of a 6.5% decline. Though the latest core PCE (personal consumption expeditures) data fell to just 1% yoy, down from 1.7% in March, part of that could be chalked up to the personal savings rate hitting an all-time high of 33%, up from 12.7% in the month prior.
In the coming months, we expect the massive fiscal stimulus provided by the passage of March's CARES Act, along with accompanying legislation, to be a much more powerful catalyst than many expect. The initial stimulus checks, ranging anywhere from $1,200 to $2,400 for most individuals and families (plus $500 per child), doled out $290 billion in direct payments, and has already proved to be an early buoy for spending on both durable and non-durable goods.
Among 6,000 people who received their checks by April 21, surveyed by economists from Columbia University, Northwestern University, the University of Chicago and the University of Southern Denmark, spending increased between $50 to $75 apiece on expenditures like food and non-durable goods in the first three days, while the purchase of durable goods increased by $20. That's not much, but it was enough to get a number of executives, particularly those from major retailers including Target, Best Buy, Lowe's, Home Depot and Walmart, talking about noticeable upticks in discretionary spending on their most recent earnings calls. Apple CEO Tim Cook reported a boost "across the board" in the wake of stimulus checks.
While the early data shows the uptick in consumer spending is only a moderate improvement, the largest share of stimulus recipients are apparently saving their checks for later. Per a separate survey from Ipsos and Axios, 38% said they chose to put their stimulus into savings, the most popular answer among survey respondents. While money being squirreled away into savings accounts in itself is not good news for spending, it's actually good news for the health of many American consumers.
The more significant boost to American consumers is going to be the CARES Act's federal enhancement to unemployment insurancea provision adding $600 per week on top of a recipient's state unemployment benefits until August. Because of this, Noah Williams, director of the Center for Research on the Wisconsin Economy at the University of Wisconsin-Madison, estimates that around 40% of all workers could theoretically earn more while unemployed than going back to work.
The effect of this will likely be twofold. First, those who are frictionally or acutely unemployed will not have their spending constrained too tightly by joblessness in the short term. Additionally, those looking to get back into work quickly could even benefit from the inflated benefits in bargaining for higher wages at their new jobs, raising average hourly earnings over the longer-term.
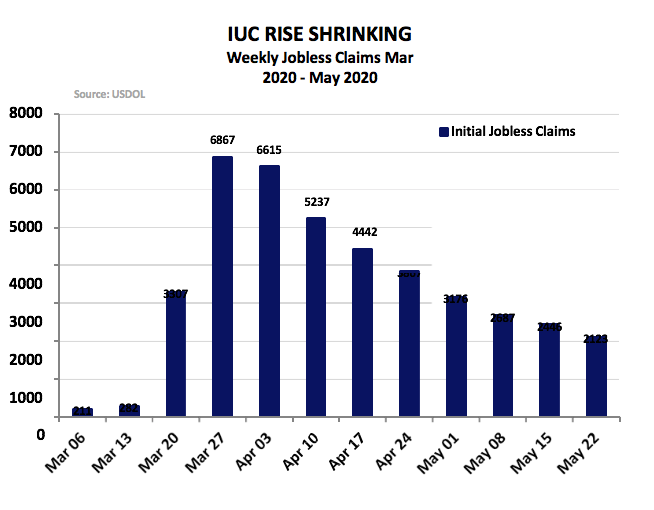
Even if employment is slow to surge back to the record highs the U.S. had seen before the outbreak of COVID-19, 80% of Americans remain employed today and the number of initial jobless claims have shrunk for eight consecutive weeks. While 40 million unemployed Americans is a tragic outcome, many had expected U.S. to be looking at a much worse employment situation than we are today.
When analyzing the data, the story seems to be a delay of demand among consumers as opposed to destruction of it. In fact, we could be looking at the most literal example of "pent-up demand" possible as most people are stuck at home, left with few places to buy, as opposed to few things they plan to buy.
What's Driving the Stock Price Surge?
As mentioned earlier, stocks have rebounded strongly from their 30%+ crash in March. While the market has seen some of its best weeks in decades leading to a recent breakout above the 3,000 mark for the S&P 500, many investors remain cautious, questioning where the bullish sentiment is coming from and how sustainable the current rally really is.
Last month, a survey by Barron's found only 39% of money managers say they're bullish about the outlook for U.S. equities this year; 20% are bearish and 41% describe themselves as neutral.
The S&P 500's first quarter (Q1) earnings are expected to fall more than 9% versus the previous quarter, while the 12-months trailing P/E (price/earnings ratio) on the S&P 500 is likely to surpass 22, based on the latest earnings estimates from S&P indices (currently 95% of companies in the index have reported for the quarter), up from about 18 in Q1/2019. Earnings are expected to fall even further in Q2/2020, which would elevate the trailing P/E even more than it already has been if stock prices remain at current levels.
Upon further analysis, there are likely two forces sustaining this rally.
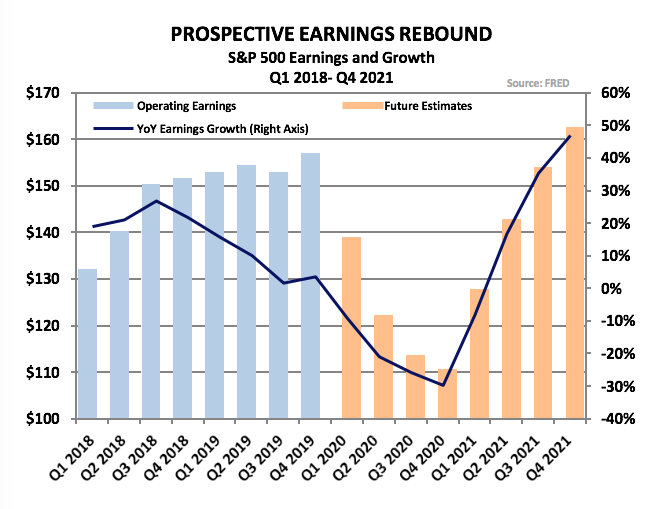
Though many in the aforementioned Barron's poll were bearish for this year, 83% are bullish on stocks' prospects for 2021, while a mere 4% say they are bears. Essentially, many investors are looking through the acute damage of the crisis and focusing on the light at the end of the tunnel in 2021. S&P indices estimates earnings for 2021 indicate double digit earnings growth in the second, third, and fourth quarters of the year.
This recovery in earnings will also help to depress price-earnings ratios. If we assume an S&P 500 worth 3,000 at the end of this quarter, the 12-months forward P/E would be about 21, still expensive, but only slightly higher than the four-year average of 20.
Along with improving expectations for 2021, we can probably chalk up some of the rising valuations to a surge of new accounts among millennial investors, rushing to take advantage of their first opportunity at bear market bargains.
Earlier this month, CNBC wrote that people earning between $35,000 and $75,000 annually increased stock trading by 90% more than the prior week after receiving their stimulus check, data show. Americans earning $100,000 to $150,000 annually increased trading 82% and those earnings more than $150,000 traded about 50% more often. "Securities trading" encompasses the buying and sells of stocks, ETFs (exchange-traded funds) or moving a 401k. Charles Schwab saw "monumental volumes" with a record 609,000 new accounts in Q1 and millennial-favored stock trading app Robinhood saw daily trades up 300% in March yoy. Robinhood also told CNBC "over half" of its customers are first-time investors.
Post-Lockdown Policy Expectations
As of last week, all states entered some phase of reopening, coinciding with a bit more optimism among economists and central bankers.
Georgia, one of the first states to begin reopening nonessential businesses at the end of April, has seen largely positive results in the wake of easing restrictions. CNN reports that the seven-day moving average of coronavirus cases steadily declined from late April until mid-May, a reflection of the earlier stay-at-home order. The moving average of cases then flattened at just over 500 new cases per day.
Per a recent JP Morgan study, almost all states have seen lower infection reproduction rates (R rates) after lockdown measures were lifted. This pattern of decline continued even when a lag period for new infections was accounted for. An R rate, or the average number of people who will become infected by one person with the virus, below 1.0 is a key indicator that the spread of the virus has been maintained. Just two states, Minnesota and North Dakota, had an R rate above 1.
Most importantly, JP Morgan said the current trajectory of the R rate shows a "second wave" of infections similar to the initial outbreak of coronavirus in the U.S. would be unlikely.
The better-than-expected data on the virus itself coincides with positive news on the monetary policy front.
Though the Fed never actively considered negative interest rates for the U.S., futures markets had been pricing them in until very recently. This rebound above zero shows that most traders are easing their expectations for the necessity of additional monetary relief.
Some at the Fed even believe we are already at the bottom of the COVID crash. Federal Reserve Bank of New York President John Williams recently told Bloomberg that "[b]ased on what we are seeing now, I think we are pretty close; maybe May or June will be the low point right now, based on the data we are seeing."
However, it is worth noting that the bank is considering yield curve control as a final major action. Yield curve control, where a central bank caps yields on government bonds of a chosen maturity through potentially unlimited purchases, has been used by Japan and was recently adopted in Australia.
Yield curve control would also be a sign of lower for longer rates, a dovish turn for a Fed that had not so long ago expected 2020 to be a year of hikes.
Analyzing the Longer-Term Outlooks
A number of respected observers have suggested that secular growth will be impaired by longer-term consequences of the pandemic and the shutdown. Deglobalization, working from home, restricted travel and burgeoning debt are all thought to negatively affect economic growth beyond a few quarters of rebound. JP Morgan has dubbed the expected rebound and subsequent drag on economic output as "Bouncing to Malaise." Others, like top economist Mohamed El-Erian of Allianz, described the longer-term outlook as part of a "new normal 2.0" that resembles the U.S.'s prolonged recovery from the financial crisis. Stanford economist Nicholas Bloom shares that view, expecting a 10% contraction in the economy and a deteriorated long-term outlook.
While El-Erian is correct in his assessments about the aftermath of the financial crisis, the slow growth and inflation of the late 2000s and early 2010s can be largely chalked up to reflexive (and sometimes excessive) regulations across the economy, enacted while the wounds of the 2008 financial crisis were still fresh and legislators more suggestible.
Though expectations for what kind of regulatory environment we'll see in the future could be heavily dependent on the 2020 election season, it's worth noting that the deregulatory trajetory the U.S. was on in 20172019 had certainly boosted growth and likely played a part in the rising wages that characterized the period.
Regardless, downbeat scenarios for the post-corona secular environment are certainly plausible, but once again, looking back might help us see what's ahead.
It is certainly ironic that we are just about a century removed from the Spanish flu, but as we stated earlier, the human and financial resolve we saw following such a disaster suggests something far more positive could develop. Indeed, the economy plunged into a brief, but steep recession in the early portion of the next decade, but almost immediately following that recession's trough, business activity surged into high gear and Americans Charlston-ed their way into the Roaring Twenties.
In a recent piece, Barron's highlighted several important parallels between the 1920s and today. America entered both decades with lower taxes, high technological innovation, and a deregulatory regime. As Mark Twain is said to have remarked, "History does not repeat itself, but it does rhyme." So, could a new Roaring Twenties be in the cards? It is certainly possible.
Beyond the immediate recovery, which we maintain will be V-shaped with the low point being mid-year, we also believe at the ensuing environment will be one of above average inflation and growth. Globalization contributed to slow job growth, stagnating wages in the U.S., along with helping to hold down inflation. The reverse Is likely to be true. As companies change supply chain arrangements and seek sources of supply closer to home (whether by choice or by mandate), domestic growth will benefit, wages should improve further and capital spending will have to accelerate.
So, although we are very concerned that the monster deficits and helicopter money will come back to haunt us eventually, we do believe that the stock markets move in the past two months is pointing the way to a strong post-corona environmentat least, for the next few years.
Joseph J. McAlinden, CFA, is the founder of McAlinden Research Partners (MRP) and its parent company, Catalpa Capital Advisors. He has 50 years of investment experience. Mr. McAlinden founded Catalpa Capital in March 2007 after leaving Morgan Stanley Investment Management, where he had spent 12 years, serving first as chief investment officer and later as chief global strategist. During his 10-year tenure as chief investment officer, he was responsible for directing MSIM's daily investment activities and oversaw more than $400 billion in assets. As chief global strategist, he developed and articulated the firm's investment policy and outlook. Prior to Morgan Stanley, Mr. McAlinden held positions as chief investment officer at Dillon Read and as president and CEO of Argus Research.
 McAlinden Research Partners (MRP) provides independent investment strategy research to investors worldwide. The firm's mission is to identify alpha-generating investment themes early in their unfolding and bring them to its clients' attention. MRP's research process reflects founder Joe McAlinden's 50 years of experience on Wall Street. The methodologies he developed as chief investment officer of Morgan Stanley Investment Management, where he oversaw more than $400 billion in assets, provide the foundation for the strategy research MRP now brings to hedge funds, pension funds, sovereign wealth funds and other asset managers around the globe.
|
|
Sign Up |
Disclosure:
1) McAlinden Research Partners disclosures are below.
2) The following companies mentioned in this article are billboard sponsors of Streetwise Reports: None. Click here for important disclosures about sponsor fees. The information provided above is for informational purposes only and is not a recommendation to buy or sell any security.
3) Statements and opinions expressed are the opinions of the author and not of Streetwise Reports or its officers. The author is wholly responsible for the validity of the statements. The author was not paid by Streetwise Reports for this article. Streetwise Reports was not paid by the author to publish or syndicate this article. Streetwise Reports requires contributing authors to disclose any shareholdings in, or economic relationships with, companies that they write about. Streetwise Reports relies upon the authors to accurately provide this information and Streetwise Reports has no means of verifying its accuracy.
4) This article does not constitute investment advice. Each reader is encouraged to consult with his or her individual financial professional and any action a reader takes as a result of information presented here is his or her own responsibility. By opening this page, each reader accepts and agrees to Streetwise Reports' terms of use and full legal disclaimer. This article is not a solicitation for investment. Streetwise Reports does not render general or specific investment advice and the information on Streetwise Reports should not be considered a recommendation to buy or sell any security. Streetwise Reports does not endorse or recommend the business, products, services or securities of any company mentioned on Streetwise Reports.
5) From time to time, Streetwise Reports and its directors, officers, employees or members of their families, as well as persons interviewed for articles and interviews on the site, may have a long or short position in securities mentioned. Directors, officers, employees or members of their immediate families are prohibited from making purchases and/or sales of those securities in the open market or otherwise from the time of the interview or the decision to write an article until three business days after the publication of the interview or article. The foregoing prohibition does not apply to articles that in substance only restate previously published company releases.
McAlinden Research Partners:
This report has been prepared solely for informational purposes and is not an offer to buy/sell/endorse or a solicitation of an offer to buy/sell/endorse Interests or any other security or instrument or to participate in any trading or investment strategy. No representation or warranty (express or implied) is made or can be given with respect to the sequence, accuracy, completeness, or timeliness of the information in this Report. Unless otherwise noted, all information is sourced from public data.
McAlinden Research Partners is a division of Catalpa Capital Advisors, LLC (CCA), a Registered Investment Advisor. References to specific securities, asset classes and financial markets discussed herein are for illustrative purposes only and should not be interpreted as recommendations to purchase or sell such securities. CCA, MRP, employees and direct affiliates of the firm may or may not own any of the securities mentioned in the report at the time of publication.


