


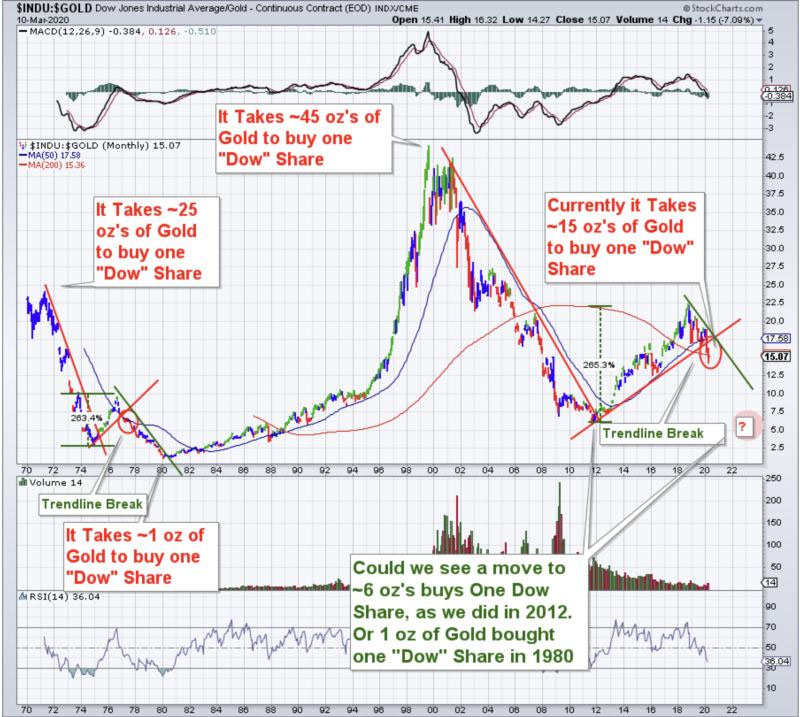
The Dow/Gold ratio broke a trend-line in past few weeks that could be signaling that gold could be trending higher against the Dow Jones Industrial Index in the next 18 months to two years.
An example might be a ratio of 10 or the Dow at 20,000 and gold at $2,000 (a new all-time high in U.S. dollars) equals 10.
Conversely, if the Dow went to 30,000 and gold went to $3,000, the ratio would equal 10. This is not a prediction but an observation.
What I found interesting was in the mid-1970s gold corrected from ~$200 to ~$100 and the Dow/Gold ratio went up ~260%, as it did again from the 2012 lows into mid-2019 but over a longer period.
John Newell is a portfolio manager at Fieldhouse Capital Management and president and CEO of Golden Sky Minerals Corp. He has 38 years of experience in the investment industry acting as an officer, director, portfolio manager and investment advisor with some of the largest investment firms in Canada. Newell is a specialist in precious metal equities and related commodities and is a registered portfolio manager in Canada (advising representative).
[NLINSERT]Disclosures:
1) John Newell: I, or members of my immediate household or family, own shares of the following companies mentioned in this article: None. I personally am, or members of my immediate household or family are, paid by the following companies mentioned in this article: None. My company currently has a financial relationship with the following companies mentioned in this article: None. I determined which companies would be included in this article based on my research and understanding of the sector. Additional disclosures/disclaimer below.
2) The following companies mentioned in this article are sponsors of Streetwise Reports: None. Click here for important disclosures about sponsor fees.
3) Comments and opinions expressed are those of the specific experts and not of Streetwise Reports or its officers. The author is wholly responsible for the validity of the statements. The author was not paid by Streetwise Reports for this article. Streetwise Reports was not paid by the author to publish or syndicate this article. The information provided above is for informational purposes only and is not a recommendation to buy or sell any security. Streetwise Reports requires contributing authors to disclose any shareholdings in, or economic relationships with, companies that they write about. Streetwise Reports relies upon the authors to accurately provide this information and Streetwise Reports has no means of verifying its accuracy.
4) The article does not constitute investment advice. Each reader is encouraged to consult with his or her individual financial professional and any action a reader takes as a result of information presented here is his or her own responsibility. By opening this page, each reader accepts and agrees to Streetwise Reports' terms of use and full legal disclaimer. This article is not a solicitation for investment. Streetwise Reports does not render general or specific investment advice and the information on Streetwise Reports should not be considered a recommendation to buy or sell any security. Streetwise Reports does not endorse or recommend the business, products, services or securities of any company mentioned on Streetwise Reports.
5) From time to time, Streetwise Reports LLC and its directors, officers, employees or members of their families, as well as persons interviewed for articles and interviews on the site, may have a long or short position in securities mentioned. Directors, officers, employees or members of their immediate families are prohibited from making purchases and/or sales of those securities in the open market or otherwise from the time of the interview or the decision to write an article until three business days after the publication of the interview or article. The foregoing prohibition does not apply to articles that in substance only restate previously published company releases.
Additional Disclosures and Disclaimer from John Newell, Fieldhouse Capital Management
Legal Notice / Disclaimer:
This document is not and should not be construed as an offer to sell or the solicitation of an offer to purchase or subscribe for any investment.
John Newell has based this document on information obtained from sources he believes to be reliable, but which has not been independently verified.
John Newell makes no guarantee, representation or warranty and accepts no responsibility or liability as to its accuracy or completeness. Expressions of opinion are those of John Newell only and are subject to change without notice. John Newell assumes no warranty, liability or guarantee for the current relevance, correctness or completeness of any information provided within this Report and will not be held liable for the consequence of reliance upon any opinion or statement contained herein or any omission.
Furthermore, I, John Newell, assume no liability for any direct or indirect loss or damage or for lost profit, which you may incur because of the use and existence of the information provided within this Report.
It should not be assumed that the methods, techniques, or indicators presented in these pages will be profitable or that they will not result in losses. Past results are not necessarily indicative of future results. Examples presented on these pages are for educational purposes only. These set-ups are not solicitations of any order to buy or sell. The authors, the publisher, and all affiliates assume no responsibility for your trading results. There is a high degree of risk in trading.
Hypothetical and historical performance results have many inherent limitations, some of which are described below. No representation is being made that any account will or is likely to achieve profits or losses similar to those shown. In fact, there are frequently sharp differences between hypothetical and historical performance results and the actual results subsequently achieved by any trading program. One of the limitations of hypothetical and historical performance results is that they are generally presented with the benefit of hindsight. In addition, hypothetical and historical trading may not present the financial risks and returns for future trading. For example, the ability to withstand losses or to adhere to a particular trading program in spite of trading losses are material points which can also adversely affect trading results. There are numerous other factors related to the markets in general or to the implementation of any specific trading program which cannot be fully accounted for in the preparation of hypothetical performance results and all which can adversely affect actual trading results.
Disclaimer: This Publication is protected by Canadian and International Copyright laws. All rights reserved. No license is granted to the user except for the user's personal use. No part of this publication or its contents may be copied, downloaded, stored in a retrieval system, further transmitted, or otherwise reproduced, stored, disseminated, transferred, or used, in any form or by any means without prior written permission. This publication is proprietary.
Neither the information, nor any opinion expressed constitutes a solicitation for the purchase of an investment program.
Chart provided by the author.


