


Gold is now a major bull market, as evidenced by its strong breakout from a giant 6-year long base pattern in August. The larger trend is up. We had thought that it might react back closer to the breakout point before turning higher again, but it didn't, and started higher again in recent days over the Christmas period. This is a sign of greater strength.
There is a broad array of fundamental reasons for a bull market of unprecedented magnitude in gold, but by far the most important of them is the ongoing and accelerating destruction of currencies by central banks. They are responding to crushing debt burdens with money creation on a gargantuan scale, and we can expect them to maintain a low or negative interest rate environment and to pump money like crazy, since faced with a choice between a liquidity lockup and systemic implosion, and rampant money creation leading to hyperinflation, they are bound to follow the latter course. It is more gradual and buys them more time. While all central banks around the world are playing the same game, they will find it very hard to keep up with the Federal Reserve of the U.S., which is ramping up money creation at a frenetic pace, the effect of which will be to collapse the dollar, which is already starting to break downhence last week's rally in gold and silver.
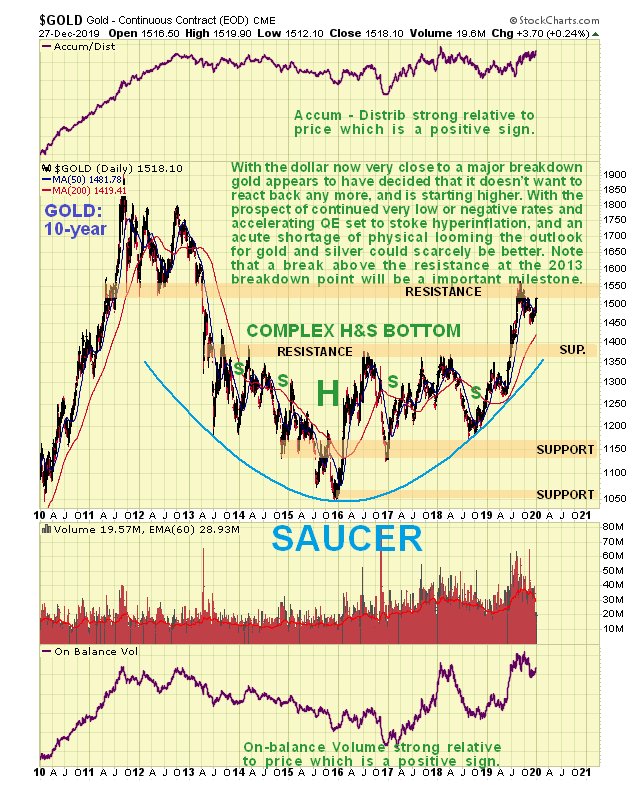
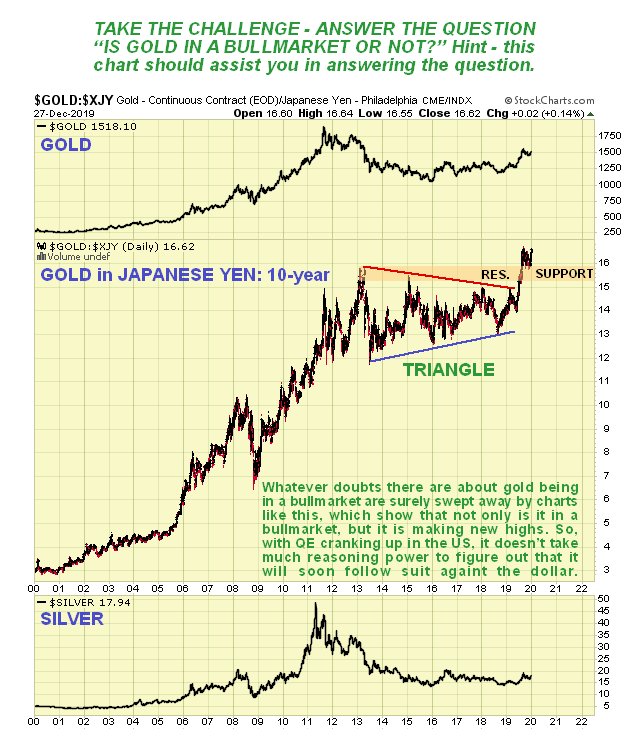
In late Augustearly September, gold stalled out exactly where we would expect it to, at resistance at the underside of the 20112013 top pattern, as we can on its 10-year chart below. This is a key important resistance level, because once gold succeeds in breaking above it, it will be in position to make a run at the 2011 highs. Once those are taken out, it will have nothing but blue sky above it. With the dollar looking vulnerable to dropping hard soon, all this could happen with remarkable speed. Before leaving this chart, note the bullishly aligned moving averages and strong volume indicators, with the accumulation line on the point of making new highs.
On the latest 6-month chart we can see recent action in detail, and how gold broke out of its intermediate downtrend from the September peak early last week on of all days, Christmas Eve. I have had some mails from people wondering if, because this breakout occurred on low volume on such a day, it makes it invalid. I don't think it does and here's why: While many ordinary investors are rushing around like headless chickens in the lead up to Christmas doing late present buying, etc., Big Money is probably much more calm and collected.
The reason for this is that they sent Jeeves to do most of the present buying in the sales back last January, and he probably had an assistant to keep driving the limo around the block for perhaps several hours before he emerged with a trolleyload of presents. Don't laugh; this is what the wealthy used to do when they shopped at Harrods in London, where parking was almost impossible.
The point is that buying around this time is more likely to be Big Money, and we saw an example of it with the dramatic reversal in the stock market around Christmas last year. Light volume or not, this breakout looks like the real thing.
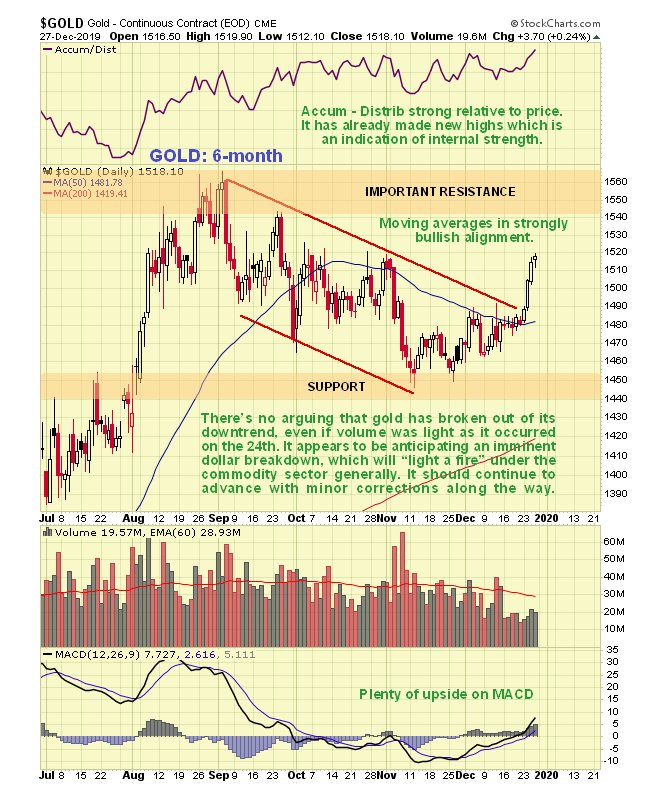
Although a tad overbought after the rally of recent days, gold is thought unlikely to react back much, if at all, before continuing higher, largely because of the fragile state of the dollar.
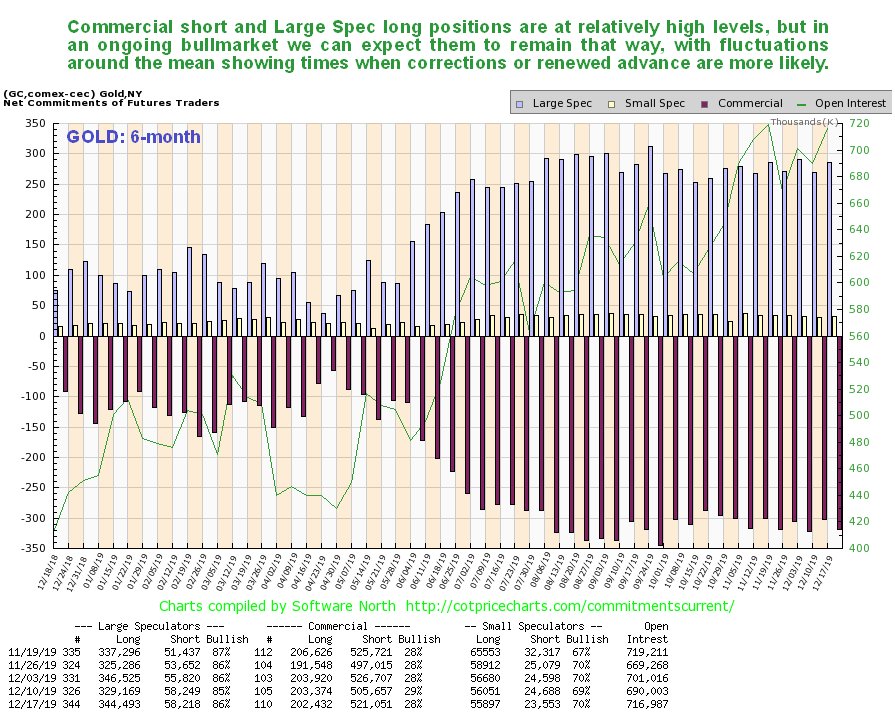
What about the COTs, which made us wary in the recent past? The situation requires a rethink given the rapidly changing environment that we are moving into. While we recognize that readings are at levels that normally lead to a significant reaction, the current setup suggests that readings are likely to stay high as this bull market progresses, only moderating somewhat on minor corrections. Of course, there is nothing to say that Commercial short and large spec long positions can't reach higher levels in the event of gold continuing to advance. So we should be mindful of COT readings, and be aware that from now on they are likely to fluctuate around mean levels that are considerably higher than they have been in recent memory.
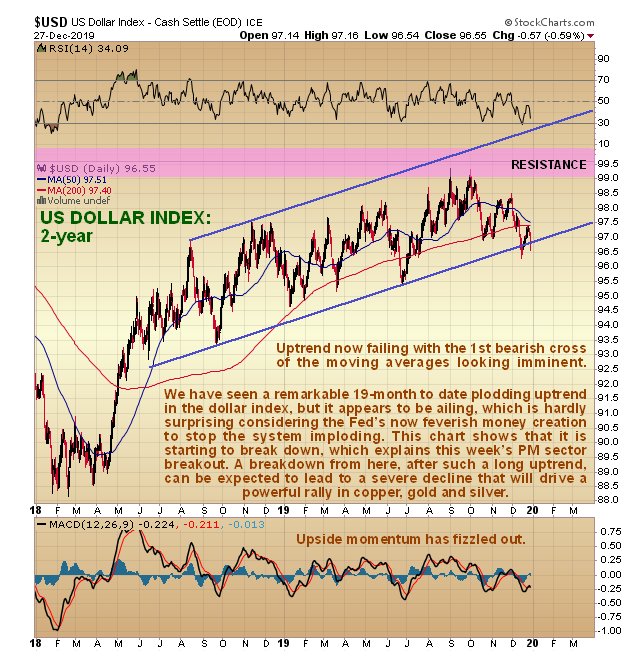
Now we come to the real concrete reason for gold and silver breaking out last week: the ailing dollar. Faced with a full frontal assault on it by the Federal Reserve printing money like crazy in a manner that no other central bank can hope to keep up with, the dollar is at last buckling under the strain and breaking down, as we can see on the latest 2-year chart for the dollar index shown below.
Given that it is breaking down from a long, shallow, ponderous uptrend that has been going on for about 20 months, this is viewed as a major development that could lead to a rapid and severe decline, especially as a so-called "death cross" looks imminent, where the 50-day moving average crosses below the 200-day. The last time this happened was early in 2017, and that lead to a big drop.
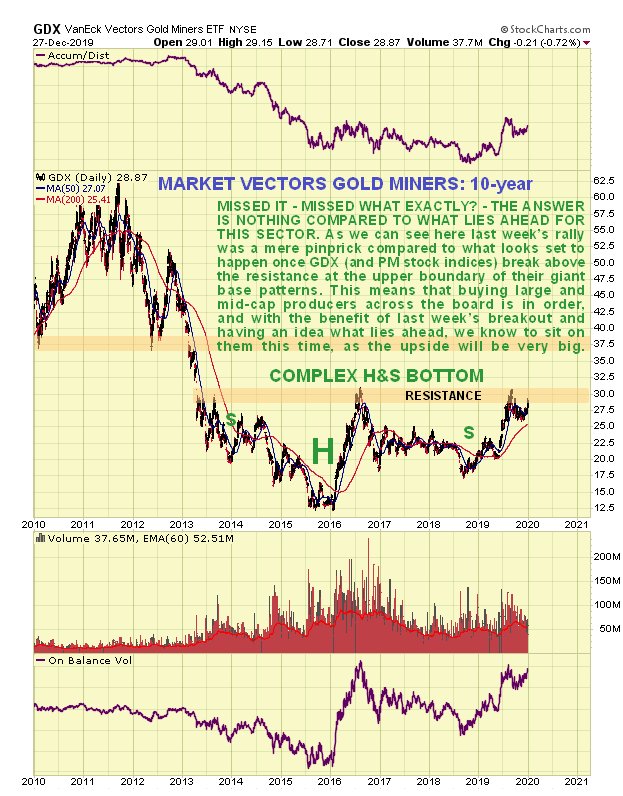
With the outlook for gold and silver now so favorable, it should come as no surprise that the charts for precious metals (PM) stocks are shaping up very well indeedand the good news is that the real big action hasn't even started yet, as we see on the latest 10-year chart for GDX.
In response to one or two accusatory e-mails I have received in recent days along the lines of "You missed ityou missed the breakout!", my response is yes, we did, but we aren't worried because the upcoming bull market in this sector is going to be so massive that we can afford to wait for it to "tip its hand" before we go all in. The rally of the past few days is a mere pinprick compared to what lies ahead.
The main point to observe on the chart below is that GDX still hasn't broken out of the giant, complex, head-and-shoulders bottom that has been forming since 2013, whose upper boundary is the zone of resistance around the $30 level. But it looks like it is very close to doing so, and once it does we can expect it to accelerate to the upside.
While there is resistance on the way up, it is not hard to understand that with gold set to advance in the not-too-distant future to the $3,000$4,000 area, GDX should have little trouble working its way through the resistance, approaching earlier peaks, and breaking out to new highs.
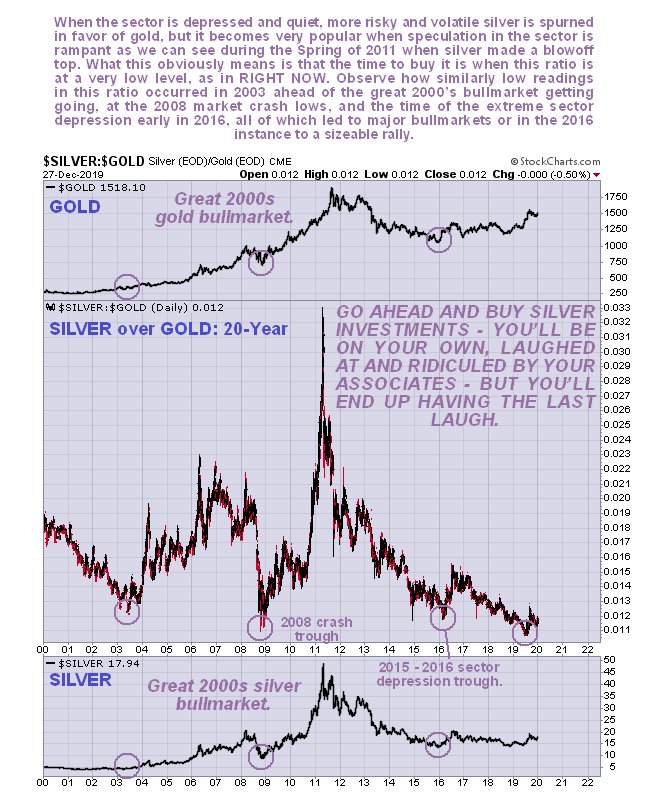
There are other important factors that point to a major sector bull market developing from here. Not least of these is the silver-to-gold ratio, whose chart is included in the parallel Silver Market update, and is reproduced for convenience below. This shows that extreme and widespread pessimism still exists toward the sector, with the ratio being at the extreme low levels it plumbed in 2003, ahead of a long and glorious bull market that ended in 2011, and again in 2008 at the general crash lows, and more recently early in 2016, when the sector was afflicted with severe depression. All those lows were followed by big and prolonged rallies, so this low should be too.
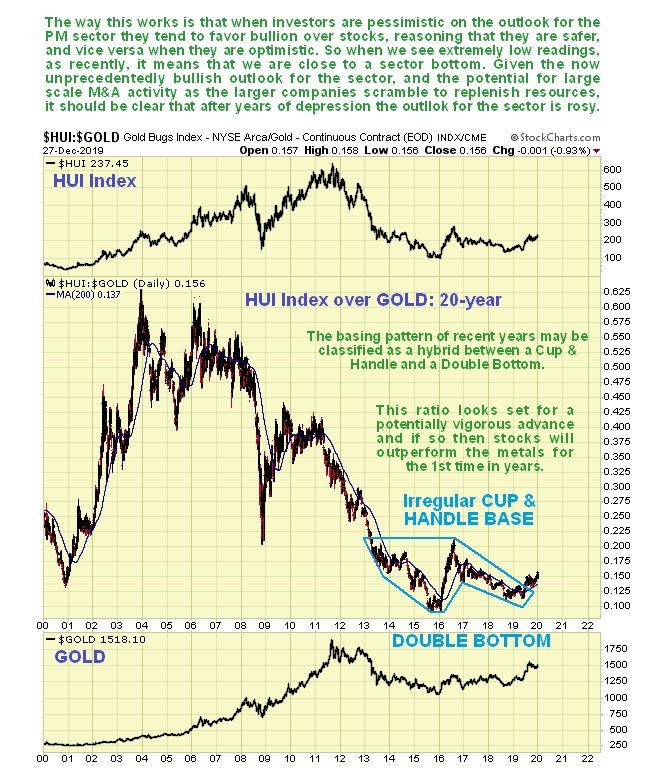
Lastly, the HUI Gold BUGS index-to-gold ratio, likewise shows that the sector is still very close to long-term cyclical lows. This ratio [has] formed a giant base pattern that may be classified either as a double bottom or as an irregular cup-and-handle base, as we see on its 20-year chart below.
The psychology behind this is simple and is as follows: When investors are fearful and negatively disposed toward the PM sector, they favor bullion over stocks, because they reason that it is a lot safer. This is, of course, true, and so at these times stocks are cheap relative to bullion, while at tops the reverse is true, with speculation rampant in stocks, which are favored over bullion. With this ratio still at a very low level, but starting to emerge from a giant base pattern, this looks like an excellent time to go overweight in this sector.
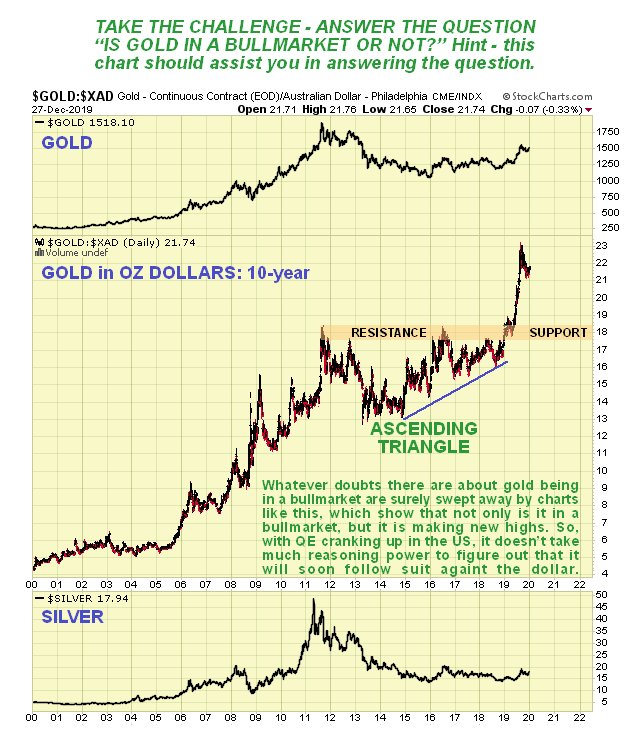
If, after reading all of the above, you are still not convinced that gold is in a bull market, the following two-step process should assist you in assuaging your doubts.
Step 1: Take a look at the following chart of gold in Australian dollars, and answer the question, "Do you think this is a bull marketyes or no?"
Step 2: Take a look at the following chart of gold in Japanese yen, and answer the question, "Do you think this is a bull marketyes or no?"
Article originally published on CliveMaund.com on Sunday, December 29, 2019.
Clive Maund has been president of www.clivemaund.com, a successful resource sector website, since its inception in 2003. He has 30 years' experience in technical analysis and has worked for banks, commodity brokers and stockbrokers in the City of London. He holds a Diploma in Technical Analysis from the UK Society of Technical Analysts.
[NLINSERT]Disclosure:
1) Statements and opinions expressed are the opinions of Clive Maund and not of Streetwise Reports or its officers. Clive Maund is wholly responsible for the validity of the statements. Streetwise Reports was not involved in the content preparation. Clive Maund was not paid by Streetwise Reports LLC for this article. Streetwise Reports was not paid by the author to publish or syndicate this article.
2) This article does not constitute investment advice. Each reader is encouraged to consult with his or her individual financial professional and any action a reader takes as a result of information presented here is his or her own responsibility. By opening this page, each reader accepts and agrees to Streetwise Reports' terms of use and full legal disclaimer. This article is not a solicitation for investment. Streetwise Reports does not render general or specific investment advice and the information on Streetwise Reports should not be considered a recommendation to buy or sell any security. Streetwise Reports does not endorse or recommend the business, products, services or securities of any company mentioned on Streetwise Reports.
3) From time to time, Streetwise Reports LLC and its directors, officers, employees or members of their families, as well as persons interviewed for articles and interviews on the site, may have a long or short position in securities mentioned. Directors, officers, employees or members of their immediate families are prohibited from making purchases and/or sales of those securities in the open market or otherwise from the time of the interview or the decision to write an article until three business days after the publication of the interview or article. The foregoing prohibition does not apply to articles that in substance only restate previously published company releases.
Charts and graphics provided by the author.
CliveMaund.com Disclosure:
The above represents the opinion and analysis of Mr Maund, based on data available to him, at the time of writing. Mr. Maund's opinions are his own, and are not a recommendation or an offer to buy or sell securities. Mr. Maund is an independent analyst who receives no compensation of any kind from any groups, individuals or corporations mentioned in his reports. As trading and investing in any financial markets may involve serious risk of loss, Mr. Maund recommends that you consult with a qualified investment advisor, one licensed by appropriate regulatory agencies in your legal jurisdiction and do your own due diligence and research when making any kind of a transaction with financial ramifications. Although a qualified and experienced stock market analyst, Clive Maund is not a Registered Securities Advisor. Therefore Mr. Maund's opinions on the market and stocks can only be construed as a solicitation to buy and sell securities when they are subject to the prior approval and endorsement of a Registered Securities Advisor operating in accordance with the appropriate regulations in your area of jurisdiction.


