

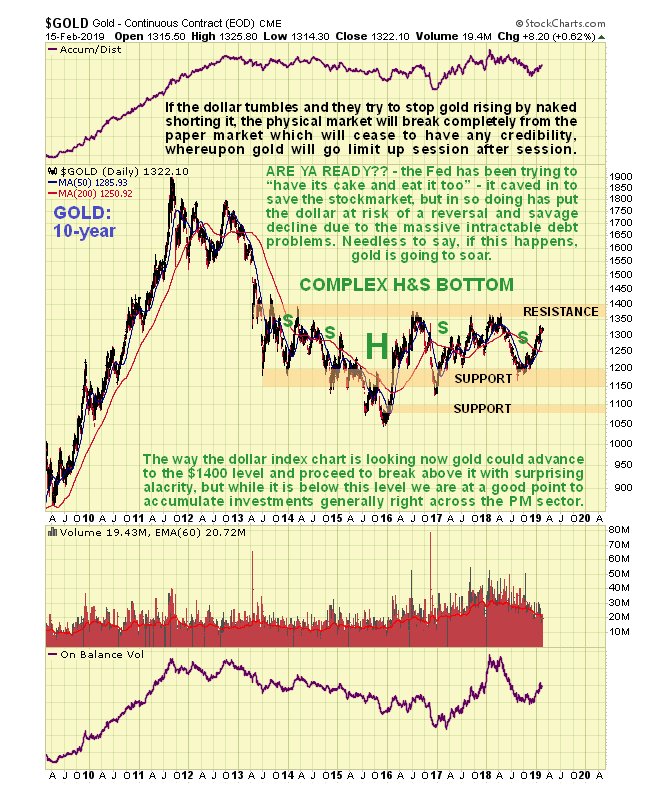
Gold has been turned back so many times in recent years from the strong resistance approaching the $1,400 level, that most investors have now been well trained, like Pavlov's dog, to expect it like clockwork, and as we know, it is just when this mindset prevails that gold is likely to surprise the majority by actually breaking out above this level.
Looking at our latest 10-year chart for gold it's not hard to see why most investors are defeatist about gold's chances of breaking out. After all it has made five more serious attempts to break above this level since mid-2013 and all have failed. Even if they see what we see on this chart, which is gold approaching completion of a giant complex Head-and-Shoulders bottom, they are still skeptical. They will mutter something about "The Cartel" and their power to clobber gold at will by manufacturing an infinite supply of paper shorts, which they then dump on the market when most of us are asleepisn't it supposed to be 300 to 1 leverage now, or is it 3,000 to 1?I've lost track. Their dastardly objective, we are told, is to maintain confidence in the fiat money system for as long as possible, because they can point to gold's feeble performance and say "Look, if it's so bad, why isn't gold going through the roof?" This negative outlook towards gold is of course promoted by the MSM (mainstream media), one of whose Prime Directives is to keep the average investor on the wrong side of the trade.
One big factor that has kept a lid on gold in recent years is the continued strength of the dollar, but with respect to this there has been a major development this year, which is the Fed caving in and starting to flip flop in order to stop the stock market crashing. However, the Fed can't have its cake and eat it tooit has to decide what it prefersa stock market driven higher by endless QE that leads to hyperinflation against the background of a collapsing dollar in the face of mammoth debts, or a high(er) interest rate policy to prop up the dollar that implodes the stock markets leading to a depressionsome choice. Their backpedaling last month to goose the markets has kicked a major prop out from under the dollar, which threatens to tip into a severe decline, and each time the Fed flip flops verbally to try to save first the stock market and then the dollar it will lose credibility, until it ends up with none, and amongst more intelligent people it hasn't got very much to start with.
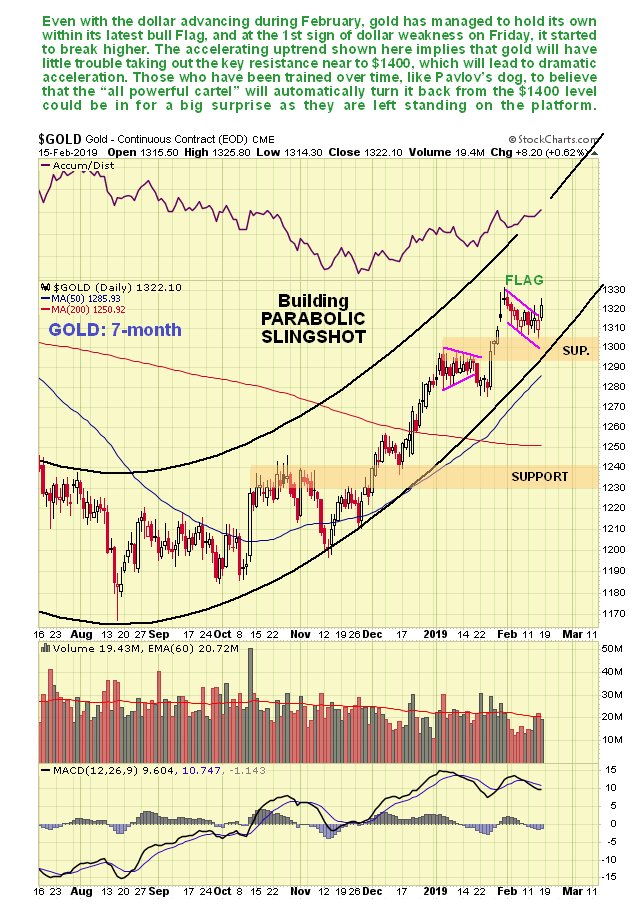
So all it will take now to trigger a gold breakout from its huge base pattern is for the dollar to roll over and drop hard, and as we will see a little later that is precisely what it is setting up to do. Gold has already got the scent of this and has been in marching towards the key breakout point in recent weeks in an increasingly vigorous uptrend, as we can see on its latest 7-month chart below. Not only has it powered through its 200-day moving average, leading to a bullish moving average cross but the uptrend is strengthening to the point that bull Flags and Pennants are starting to form, with the price now on the point of breaking out of the latest one. What is going on is that gold is in the early stages of a parabolic slingshot uptrend as shown, that should soon vault it above the key resistance approaching and around $1,400. Once it breaks above this resistance it is expected to accelerate dramatically.
We cannot consider the latest COTs because they are hopelessly out of date, thanks to the government shutdown.
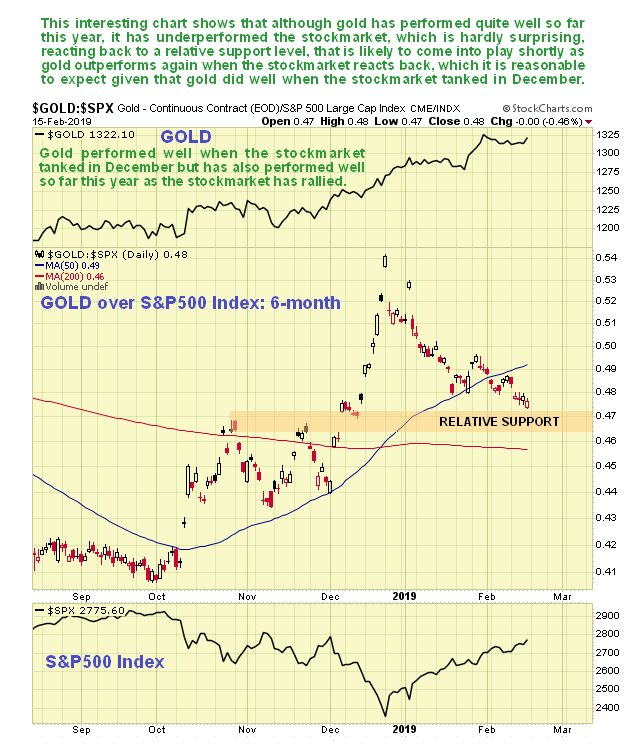
It is most worthwhile comparing gold's performance relative to the stock market in the recent past. On a 6-month chart for gold over the S&P500 index, with gold at the top and the S&P500 index at the bottom, there are two very important observations to be made. The first is that gold performed well when the stock market tanked in Decemberthis is important to know, because it means that if the market tanks again soon, gold will likely do well as a safe haven, unlike in 2008, which will probably be due to the dollar being weak at the same time. The second key point to observe is that even though gold has done quite well so far this year, it has still taken a back seat to the stock market, against which it has underperformed, resulting in a correction on its relative chart back to relative support, which again suggests that gold will shine if the stock market turns and drops hard, as in December.
Alright, so how are Precious Metals stocks shaping up? Very well as it happens and we have already lighted on a range great looking stocks on the site.
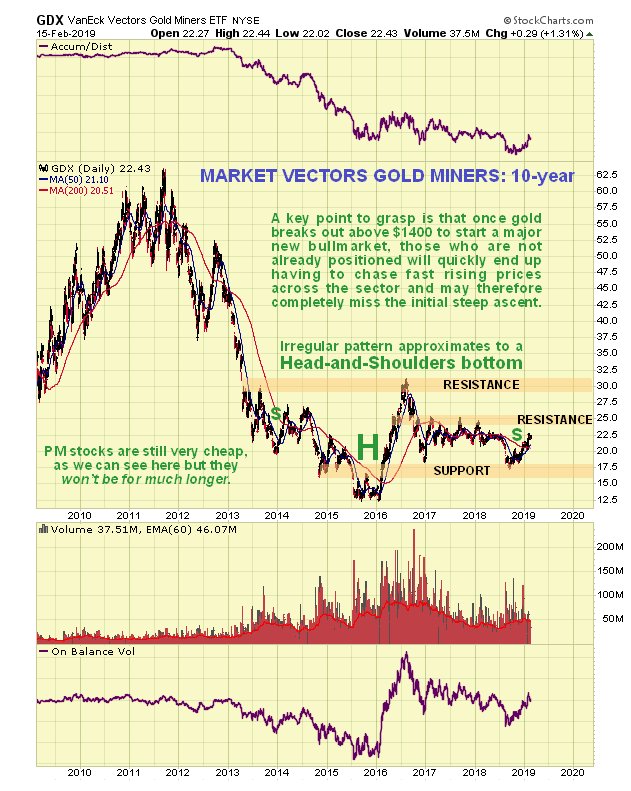
On the 10-year chart for PM stocks proxy GDX, we can see that it is moving towards completion of a giant base pattern that is roughly similar to the one completing in gold, and although it looks like it is rather "dragging its feet" compared to gold, it is clear that once it gets above the clear line of resistance approaching and at $25, it is likely to accelerate noticeably towards the next resistance in the $30 area at the upper boundary of the pattern. This means that many stocks that are still available at very good prices now are going to become a lot more expensive in a hurry once GDX (and PM indices generally) starts accelerating away to the upside.
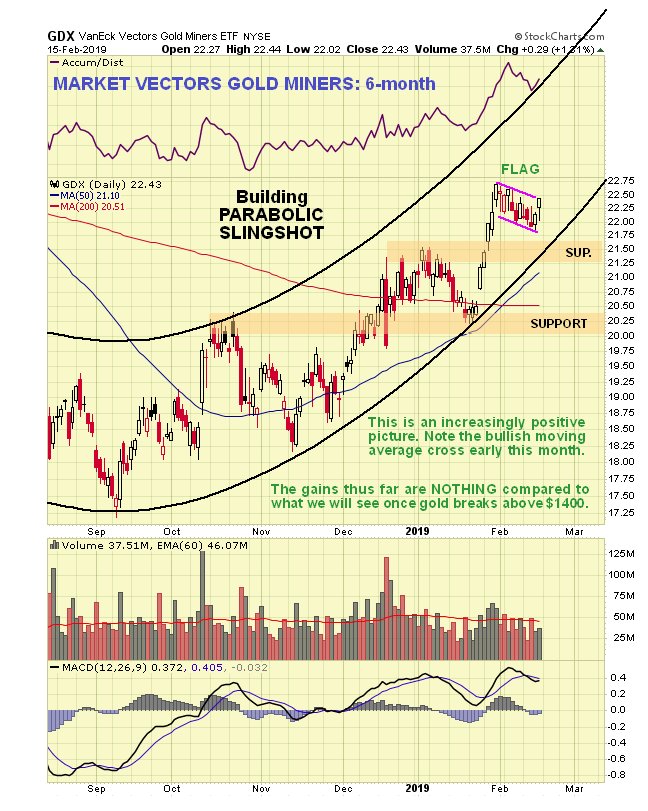
The 6-month chart for GDX looks very similar to the 7-month chart for gold, and shows a parabolic slingshot move that is expected to accelerate dramatically to the upside once it breaks above the resistance at the upper boundary of the base pattern in the $30 area. Right now it looks like it is about to advance steeply as it is just starting to break out upside from a small bull Flag.
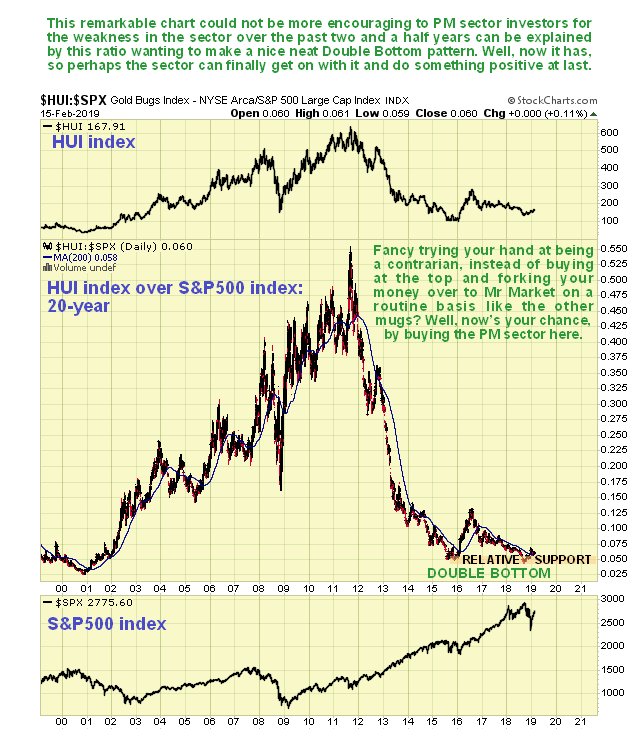
Now we look at a most interesting chart which shows how cheap gold stocks are now compared to the broad stock market, the 20-year chart for the HUI GoldBUGS index over the S&P500 index. It shows that gold stocks have only been this cheap in relation to the general stock market on two other occasions in the past 20 yearslate 2000 before the great 2000s sector bull market and at the end of 2015, and the sector is only a little above this level now.
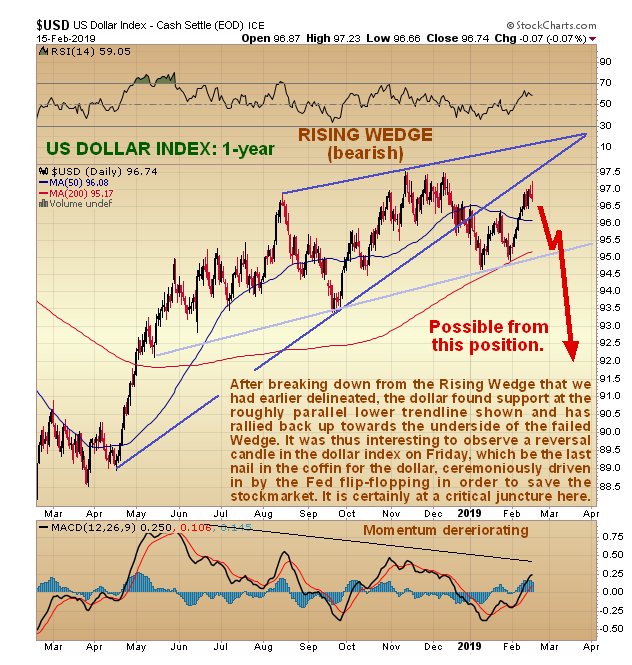
Now we turn to the all-important dollar, all-important that is until it loses its Reserve Currency status. On the 1-year chart for the dollar index we see that early in January it broke down from its bearish Rising Wedge and started to drop away, but its decline was arrested by a parallel channel support line shown in pale blue, and it has since zig-zagged up towards strong resistance at the underside of the failed Wedge and approaching the NovemberDecember peaks, where it started to run into trouble late last week, with a bearish candle indicating reversal appearing on its chart on Fridaythis was the reason that the PM sector became perky. It is very vulnerable here, especially after the Fed Chair Jay Powell turned "yellow" last month in a bid to stop the stock market crashing, implying that rate rises will be curtailed, and it is the program of rate rises up to now that has been a key factor driving the dollar higher of coursewith that gone it could drop and drop hard, which would of course be great news for gold, and commodity prices generally.
Gold looks like it is building up to breaking above the key $1,400 level to enter a major growth phase that could dwarf anything seen hitherto, which we can expect to synchronize with the dollar accelerating away to the downside and lead to precious metals stocks doing a "moonshot," which won't be hard considering how depressed and undervalued most of them still are, and how lean and efficient most mining companies are now as a result of having had to battle through hard times for years. If "The Cartel" try to stop gold going up in this environment by unloading an avalanche of naked shorts, we can expect the market in physical gold to disassociate itself from the paper market to the extent that the latter is bypassed and rendered irrelevantthis will probably happen as a result of more and more buyers demanding physical and no longer accepting paper certificates. When this happens gold could go limit up for days on end.
Clive Maund has been president of www.clivemaund.com, a successful resource sector website, since its inception in 2003. He has 30 years' experience in technical analysis and has worked for banks, commodity brokers and stockbrokers in the City of London. He holds a Diploma in Technical Analysis from the UK Society of Technical Analysts.
[NLINSERT]Disclosure:
1) Statements and opinions expressed are the opinions of Clive Maund and not of Streetwise Reports or its officers. Clive Maund is wholly responsible for the validity of the statements. Streetwise Reports was not involved in the content preparation. Clive Maund was not paid by Streetwise Reports LLC for this article. Streetwise Reports was not paid by the author to publish or syndicate this article.
2) This article does not constitute investment advice. Each reader is encouraged to consult with his or her individual financial professional and any action a reader takes as a result of information presented here is his or her own responsibility. By opening this page, each reader accepts and agrees to Streetwise Reports' terms of use and full legal disclaimer. This article is not a solicitation for investment. Streetwise Reports does not render general or specific investment advice and the information on Streetwise Reports should not be considered a recommendation to buy or sell any security. Streetwise Reports does not endorse or recommend the business, products, services or securities of any company mentioned on Streetwise Reports.
3) From time to time, Streetwise Reports LLC and its directors, officers, employees or members of their families, as well as persons interviewed for articles and interviews on the site, may have a long or short position in securities mentioned. Directors, officers, employees or members of their immediate families are prohibited from making purchases and/or sales of those securities in the open market or otherwise from the time of the interview or the decision to write an article until three business days after the publication of the interview or article. The foregoing prohibition does not apply to articles that in substance only restate previously published company releases.
Charts provided by the author.
CliveMaund.com Disclosure:
The above represents the opinion and analysis of Mr Maund, based on data available to him, at the time of writing. Mr. Maund's opinions are his own, and are not a recommendation or an offer to buy or sell securities. Mr. Maund is an independent analyst who receives no compensation of any kind from any groups, individuals or corporations mentioned in his reports. As trading and investing in any financial markets may involve serious risk of loss, Mr. Maund recommends that you consult with a qualified investment advisor, one licensed by appropriate regulatory agencies in your legal jurisdiction and do your own due diligence and research when making any kind of a transaction with financial ramifications. Although a qualified and experienced stock market analyst, Clive Maund is not a Registered Securities Advisor. Therefore Mr. Maund's opinions on the market and stocks can only be construed as a solicitation to buy and sell securities when they are subject to the prior approval and endorsement of a Registered Securities Advisor operating in accordance with the appropriate regulations in your area of jurisdiction.


