

The sharp drop in the bond market and stock market late last week, especially on Friday, is believed to mark the start of a long and brutal bear market, exacerbated by the attempt to deleverage massive debt. Since bear markets are not noted for being characterized by expansion in demand, the onset of a severe recession or depression in due course can be expected to have a serious negative impact on demand for oil, with another more immediate negative factor for oil being that any sustained increase in prices, such as we have already seen, will result in a ramping of production in the US that will negatively impact prices as well.
Thus we can see that "the writing is on the wall" already for oil which can be expected to break down from its uptrend in force from last July to enter a prolonged and potentially severe downtrend. As you are already aware, we have been looking for oil to go into reverse for some weeks now, and now it has the perfect excuse, a falling stock market, and the drop by oil stocks in sympathy with the drop in stocks generally on Friday portends a downtrend in oil.
This article is not an exercise in idle observation of what of going on, for we plan to make money out of this impending and imminent oil drop, while most others are losing it, but become we come to details of how to profitably play it, we will first look at the latest charts for oil itself and the oil stocks index.
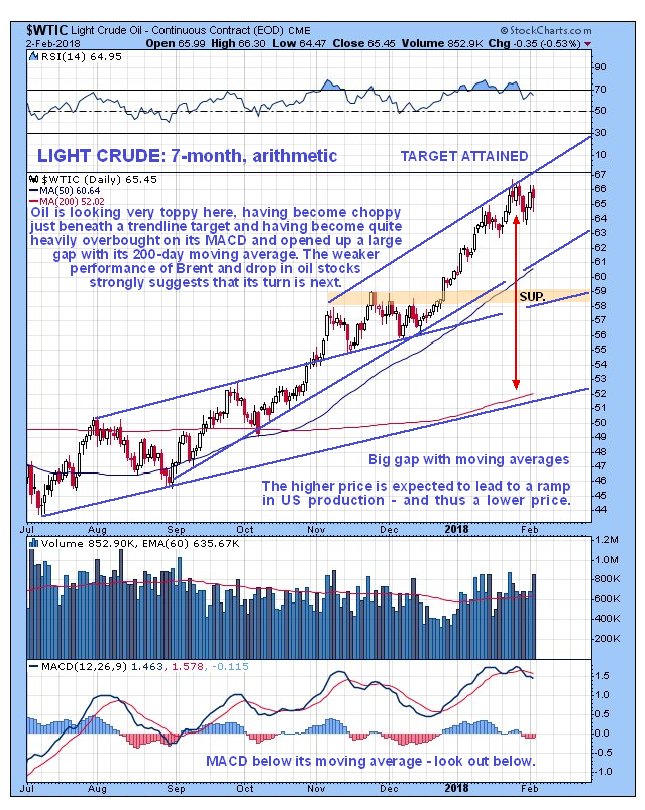
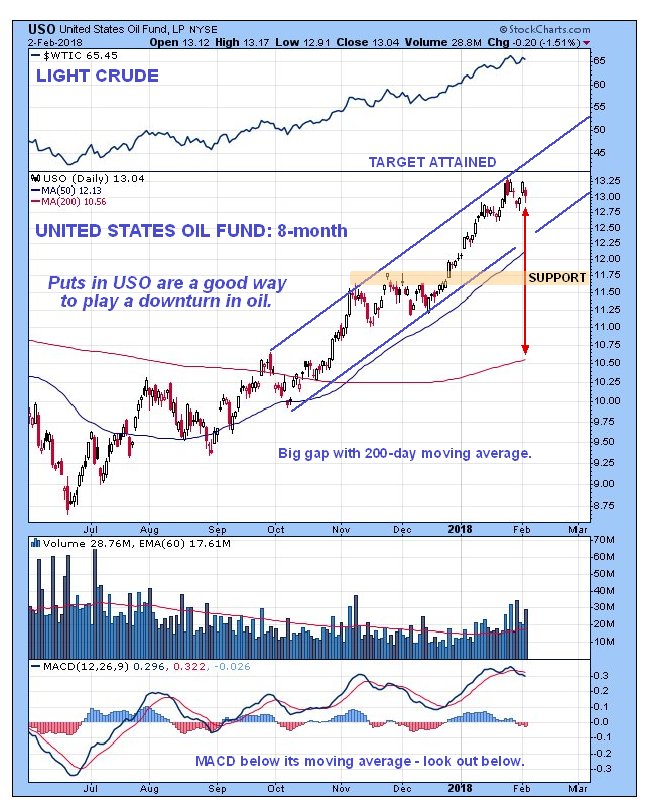
We start with the 7-month chart for Light Crude on which we see that having hit a target at the upper boundary of its steeper uptrend channel several weeks ago, it has been bumping along the underside of it since, and while this chart by itself looks fairly innocuous, with little sign of a serious downturn, such is not the case with the latest COT and Hedgers' charts, which are the stuff of nightmaresunless you are short that is (short the oil market, not short in stature). Before leaving this chart, observe how the MACD indicators has dropped below its moving average, which is viewed as a warning, and the now large gap between the price and the 200-day moving average, which makes at least a correction more likely.
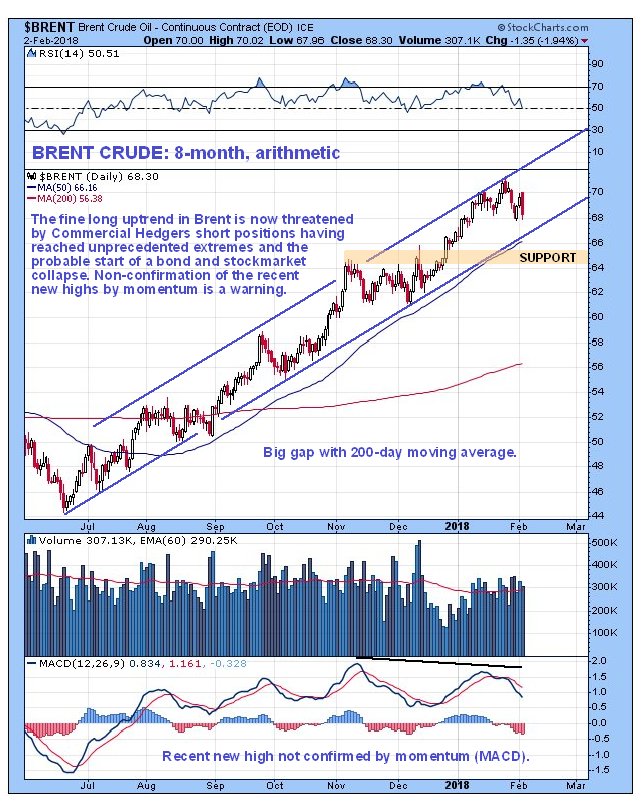
Another warning is being flashed by the related chart for Brent Crude. On Brent's 8-month chart we can see that whilst it remains in a fine uptrend that started back last June, this uptrend is subtly weakening, which is revealed by the new high in January not being confirmed by momentumthe MACD indicator did not make a new high.
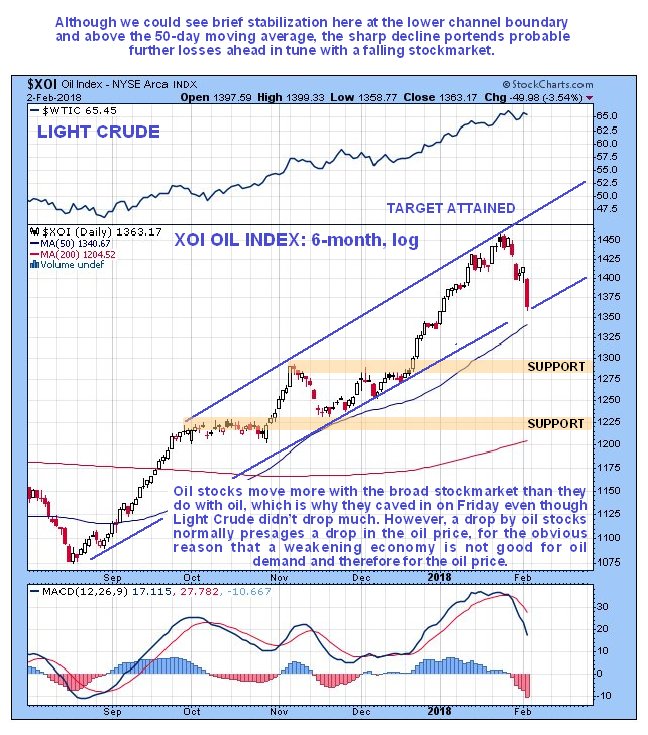
Still another and much more stark warning is being given by the XOI oil stocks index. While oil stocks are much more inclined to move with the broad stock market than with oil itself, they dropped like a rock on Friday in sympathy with the broad market, even though Light Crude didnt drop muchyet. The reason for this is logicalif the stock market drops hard, the outlook for the economy deteriorates, and that means less demand for oil and thus lower prices ahead, and less profit for oil companies. So dropping oil stocks usually lead to a drop in the price of oil itself.
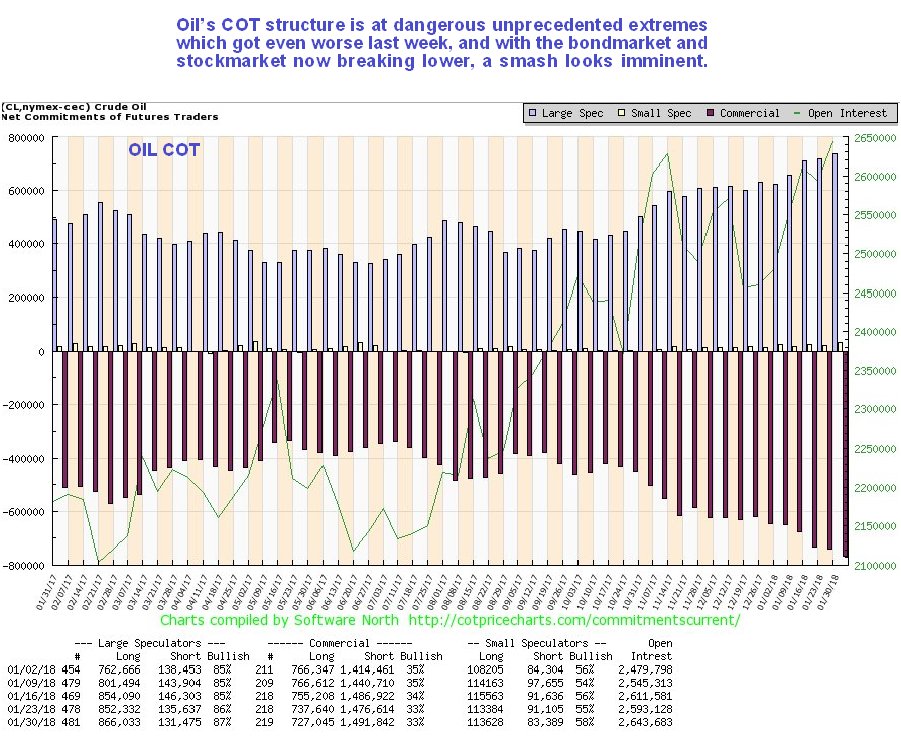
The latest oil COT chart shows that the Large Specs are "off the scale" bullish, and have record long positions by a huge margin, and since they are almost always wrong, it means that a reversal by oil is a fast growing probability.
Click on chart to pop-up a larger, clearer version.
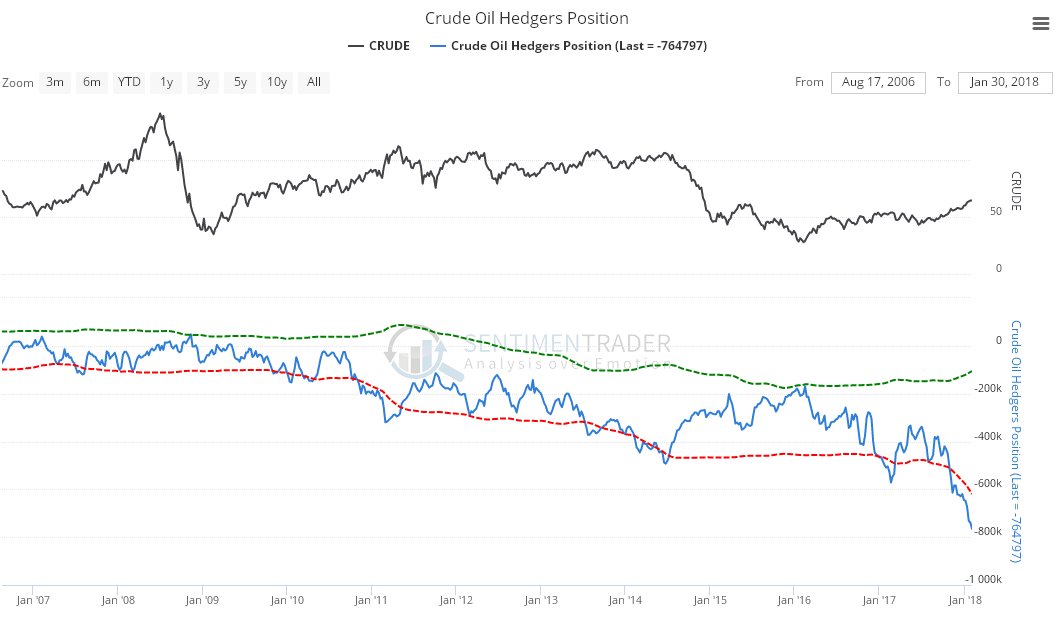
The latest oil Hedgers' chart is at jaw dropping extremes, which means that unless "this time its different"you know, like it was just a few months or even weeks ago with Bitcoin, Blockchain and Cryptos and even cannabis stocks, oil is going to get really slammed hard, and soon. Recent longs will be left in tatters and new shorts should make big money.
Click on chart to pop-up a larger, clearer version.
Chart courtesy of sentimentrader.com
That's enough theorizing; now we come to the crux of this article, which is how we are going to make money out of it, while most others are losing their shirts. There are two waysinverse ETFs and Puts, and since we are expecting a severe decline and not here to fool around, the ETFs might as well be leveraged. Unleveraged ETFs are too sedate and pedestrian for us, so we will want to go for either double leveraged ones or triple leveraged. The triple leveraged ones have a high "decay factor" and are not for the timidthey "take no prisoners"you have to be as sure as you can be that a big move is imminent, and in this case we are. We are going to focus on oil inverse ETFs because the oil stocks inverse ETF train is already pulling out of the station, thanks to oil stocks plunging on Friday.
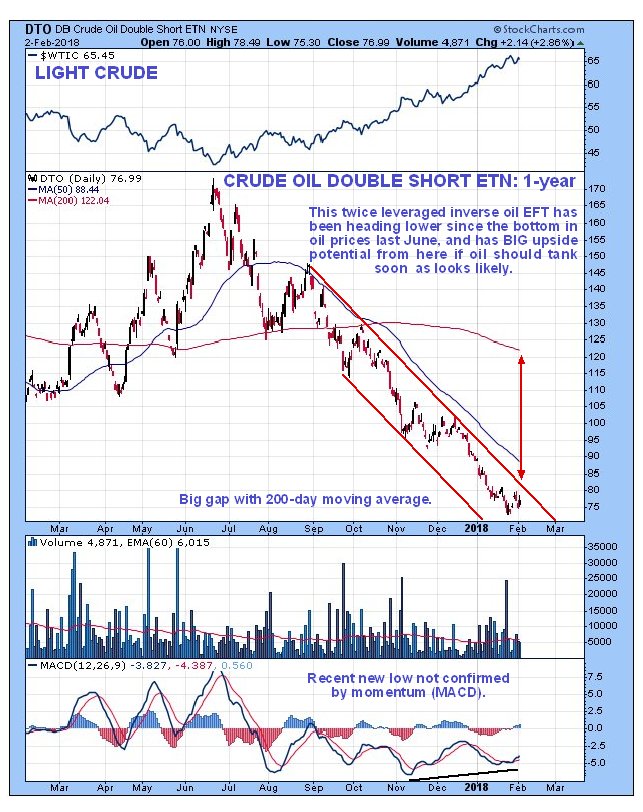
So, we will start by looking at the double leveraged DB Crude Oil Double Short ETN, DTO. On its 1-year chart we can see that it has been in severe decline since last June, having fallen from a high at about $175 to the current $77 in a persistent steep downtrend, which at this point remains unbroken. However, given what is going on with the stock market and oil stocks, it is expected to break out of this downtrend into a potentially steep uptrend as oil goes into reverse. Observe the inverse correlation with the oil price shown at the top of the chart.
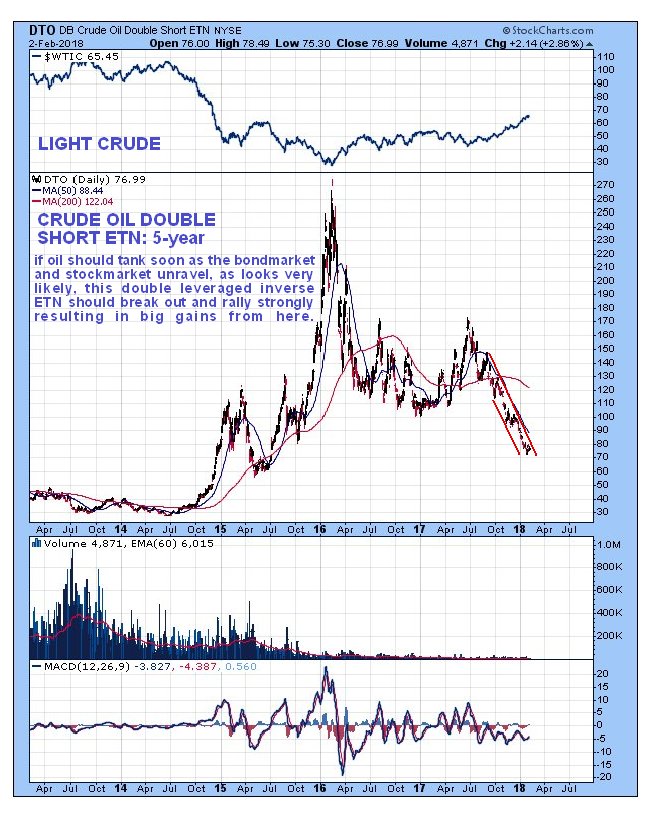
The 5-year chart for this DB Crude Oil Double Short ETN is very interesting to observe, as it shows us the kind of moves it can make when oil caves in, although part of the reason for the extraordinary decline in oil in 2014 and 2015 was the Neocons attempt to cripple Russia, which failed. This time oil will drop because of collapsing markets and economy.
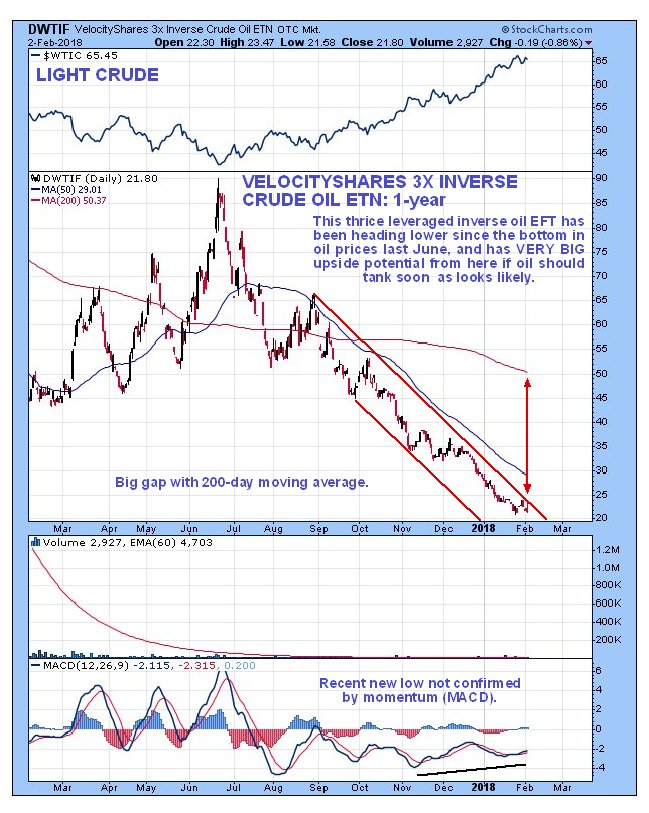
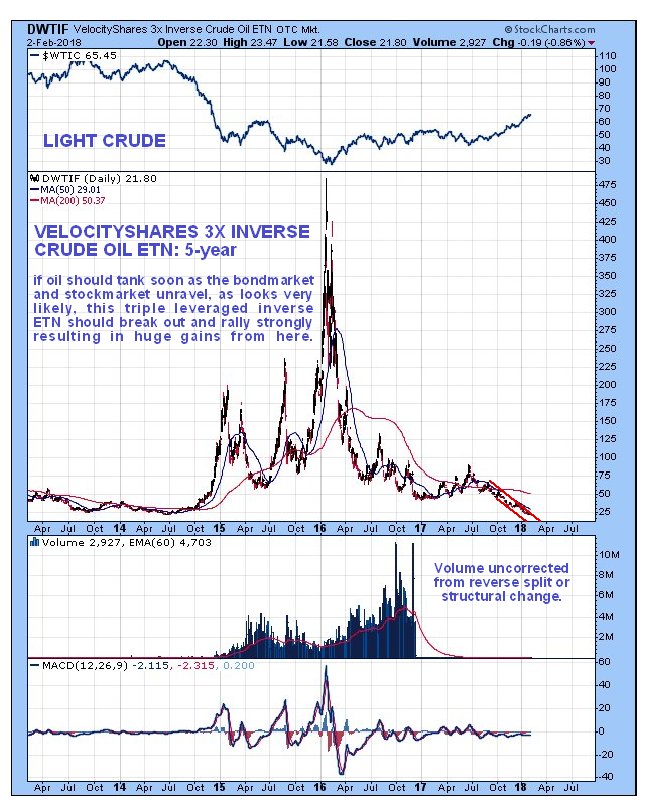
If you want to "up the ante" and increase the number of credits per bet, then a good vehicle to use is the VelocityShares 3X Inverse Crude Oil ETN, DWTIF. The chart for this is almost identical to that for DTO, except it is considerably more leveraged, so we don't need to discuss it in detail.
The 5-year chart for the VelocityShares 3X Inverse Crude Oil ETN shows that it is capable of humongous gains when the oil price drops hard, which is nice to observe, especially since some of these triple leveraged ETFs fail to perform as one would expect when a big move in your favor occurs.
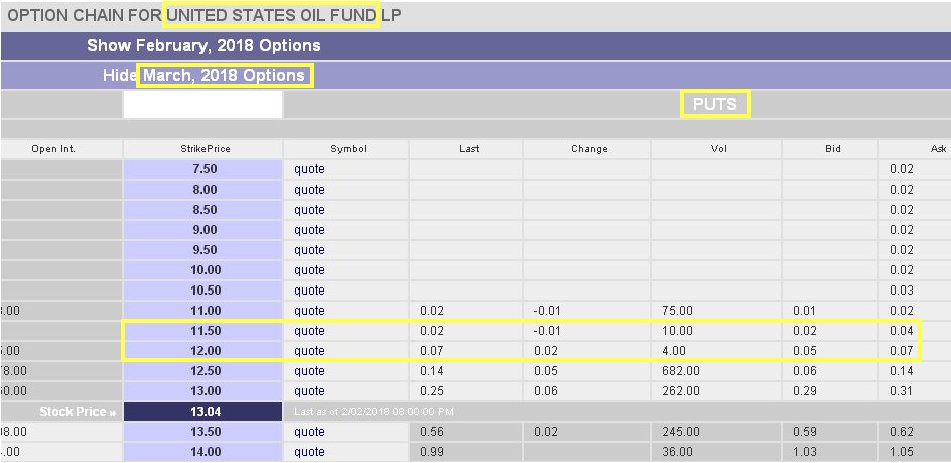
Finally, for those of you who "really want to push the boat out" and can handle the risk involved, a very attractive play at this time is Puts in The United States Oil fund, USO.
Suggested USO Puts to go for are the March $12s at $0.07 ask or even the March $11.50s at $0.04 ask. We might as well go well "out of the money" for the leverage here, since the move could be big. Note that these prices may be raised at the open Monday, if oil starts the day weak.
Click on chart to pop-up a larger, clearer version.
Clive Maund has been president of www.clivemaund.com, a successful resource sector website, since its inception in 2003. He has 30 years' experience in technical analysis and has worked for banks, commodity brokers and stockbrokers in the City of London. He holds a Diploma in Technical Analysis from the UK Society of Technical Analysts.
Want to read more Gold Report articles like this? Sign up for our free e-newsletter, and you'll learn when new articles have been published. To see a list of recent articles and interviews with industry analysts and commentators, visit our Streetwise Interviews page.
Disclosure:
1) Statements and opinions expressed are the opinions of Clive Maund and not of Streetwise Reports or its officers. Clive Maund is wholly responsible for the validity of the statements. Streetwise Reports was not involved in the content preparation. Clive Maund was not paid by Streetwise Reports LLC for this article. Streetwise Reports was not paid by the author to publish or syndicate this article.
2) This article does not constitute investment advice. Each reader is encouraged to consult with his or her individual financial professional and any action a reader takes as a result of information presented here is his or her own responsibility. By opening this page, each reader accepts and agrees to Streetwise Reports' terms of use and full legal disclaimer. This article is not a solicitation for investment. Streetwise Reports does not render general or specific investment advice and the information on Streetwise Reports should not be considered a recommendation to buy or sell any security. Streetwise Reports does not endorse or recommend the business, products, services or securities of any company mentioned on Streetwise Reports.
3) From time to time, Streetwise Reports LLC and its directors, officers, employees or members of their families, as well as persons interviewed for articles and interviews on the site, may have a long or short position in securities mentioned. Directors, officers, employees or members of their immediate families are prohibited from making purchases and/or sales of those securities in the open market or otherwise from the time of the interview or the decision to write an article, until one week after the publication of the interview or article.
Charts provided by the author.
CliveMaund.com Disclosure:
The above represents the opinion and analysis of Mr Maund, based on data available to him, at the time of writing. Mr. Maund's opinions are his own, and are not a recommendation or an offer to buy or sell securities. Mr. Maund is an independent analyst who receives no compensation of any kind from any groups, individuals or corporations mentioned in his reports. As trading and investing in any financial markets may involve serious risk of loss, Mr. Maund recommends that you consult with a qualified investment advisor, one licensed by appropriate regulatory agencies in your legal jurisdiction and do your own due diligence and research when making any kind of a transaction with financial ramifications. Although a qualified and experienced stockmarket analyst, Clive Maund is not a Registered Securities Advisor. Therefore Mr. Maund's opinions on the market and stocks can only be construed as a solicitation to buy and sell securities when they are subject to the prior approval and endorsement of a Registered Securities Advisor operating in accordance with the appropriate regulations in your area of jurisdiction.


