

We've all had people come up to us and say "Do you want the good news first or the bad news?" I always opt for the bad news first, to get it out of way and end on a lighter note. The bad news is that the dollar looks set to stage a significant "swan-song" rally in coming weeks, which will probably result in gold being beaten down again. The good news is that once that's done its toastand that's when the big gold and silver bull market that longer-term charts are calling for will really get underway.
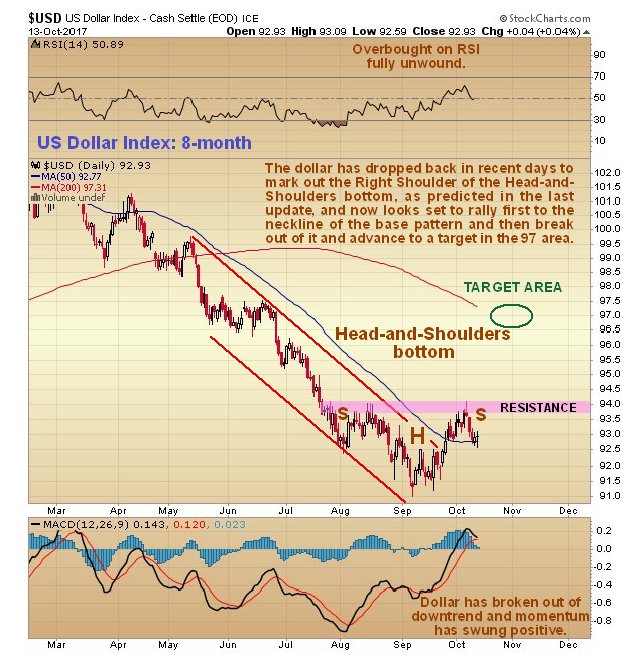
The last update called for the dollar to drop down to mark out the Right Shoulder of a Head-and-Shoulders bottom pattern, and for gold to break out of its rather steep intermediate downtrend and rally, and that is exactly what has since happened. On its latest 8-month chart, we can see how the dollar has backed off to the vicinity of its flattened out 50-day moving average and the vicinity of the Left Shoulder low of the base pattern, in order to mark out the Right Shoulder low. Three bullish developments to be noted that result from the dollar rising out of the Head of the pattern are the breakout from the downtrend, the break clear above the 50-day moving average, and the big improvement in momentum (MACD), which is swinging positive. If our interpretation that this is a genuine Head-and-Shoulders bottom is proven valid, the pattern targets the 97 area in coming weeks, probably by early November. Needless to say, this will not be good news for gold and silver prices.
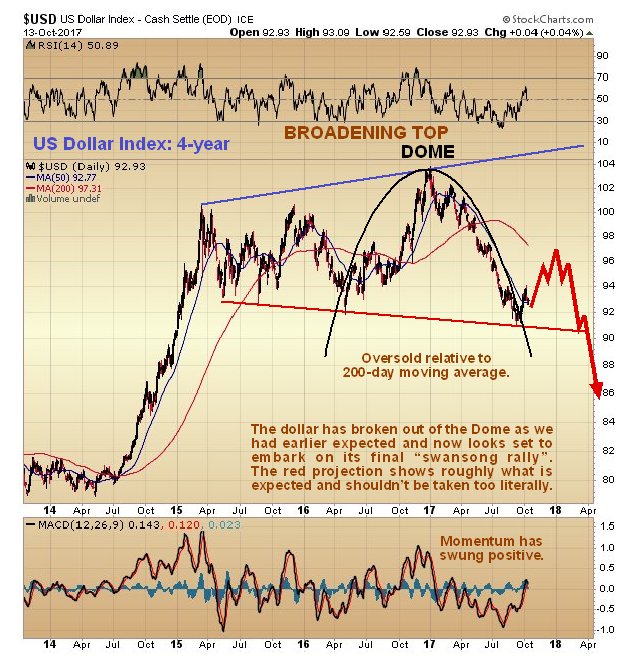
Our prediction made many weeks ago that the dollar would rally off the lower boundary of its big bullhorn pattern shown on the 4-year chart below to break out above its restraining Dome has proven to be correct, and a projection has been drawn on this chart showing roughly what is expected to happen. As we saw above on the 8-month chart, the base pattern now approaching completion targets the 97 area approx. This is the "swan-song rally"the dollars last rally before it "hands in its dinner pail," and should present a wonderful last opportunity to accumulate the better gold and silver stocks, before the dollar does an about face, and breaks down from the large Broadening Top pattern into a severe decline.
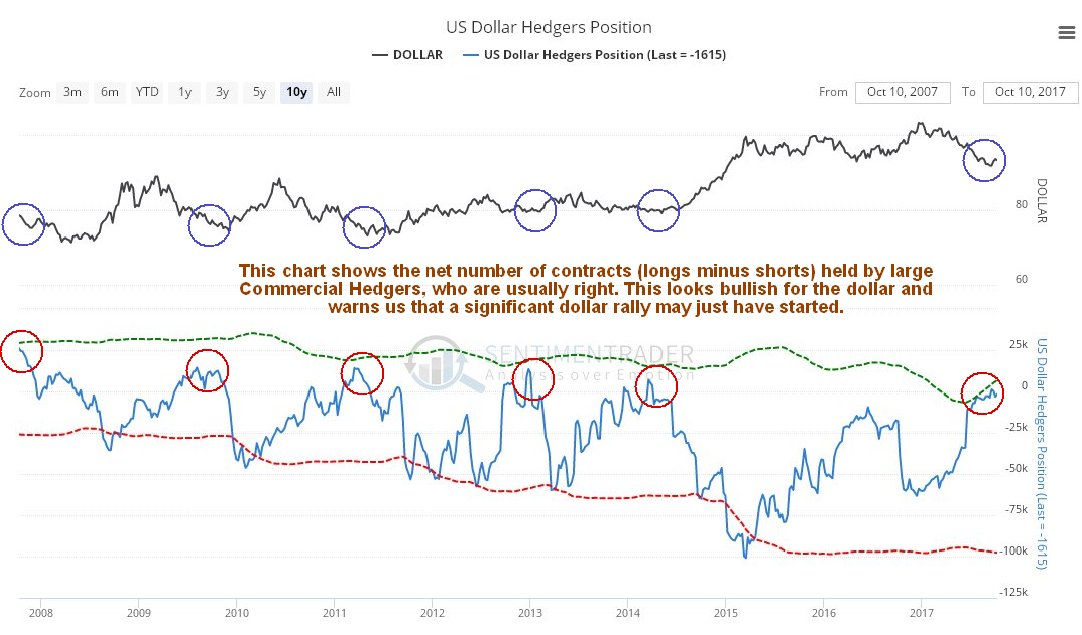
The Hedgers chart has been warning for weeks that the dollar will reverse and rally, as has been pointed out repeatedly. The latest chart shows the rally is still ahead of uswhich is congruent with the dollar being at the Right Shoulder low of its Head-and-Shoulders bottom.
Click on chart to pop up a larger clearer version.
Chart courtesy of www.sentimentrader.com
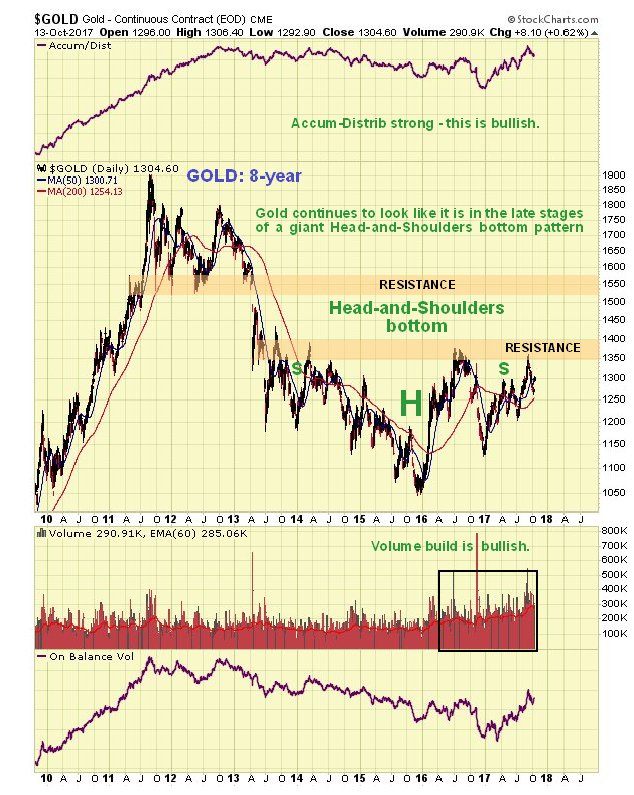
In light of the above it is logical to expect gold's plucky little breakout from the steep downtrend channel shown on its 6-month chart below to abort, and if the dollar advances towards the 97 area on the index, we would expect gold to react back, probably to the $1200$1215 area.
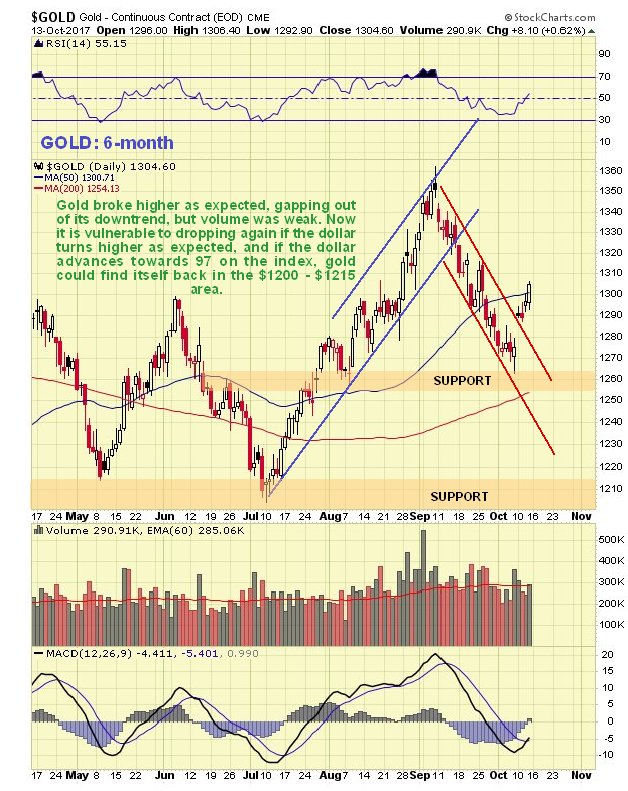
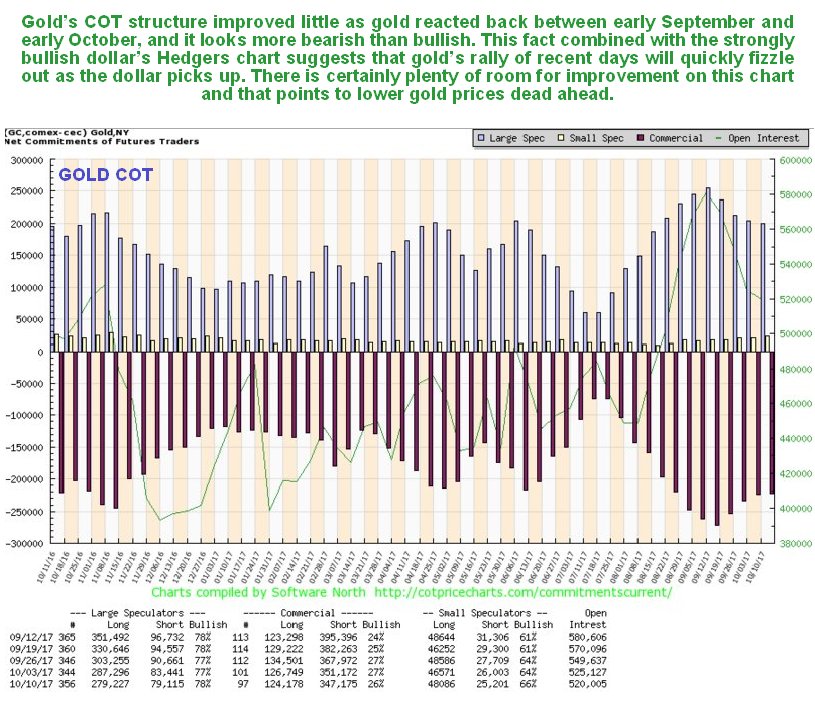
Such a reaction back by gold accords with its latest COT chart, which still looks more bearish than bullish, since gold's COT structure improved but little on its recent downtrend. There is still a lot of room for improvement on this chartand that probably means lower gold prices dead ahead. . .
Click on chart to popup a larger clearer version.
On gold's 8-year chart it continues to look like it is in the late stages of a giant Head-and-Shoulders bottom pattern. The build up in volume over the past 20 months certainly looks positive, especially over the past several months, all the more so because it has driven volume indicators higher, notably the Accum-Distrib line, which is not far off making new highsexceeding its level at the 2011 peak. Once gold breaks above the resistance level approaching $1400 it will be on its way, although it will then have to contend with another important band of resistance in the $1510$1560 range. A near-term retreat by gold to the $1200$1215 area in the face of a dollar rally will not damage this long-term technical picture.
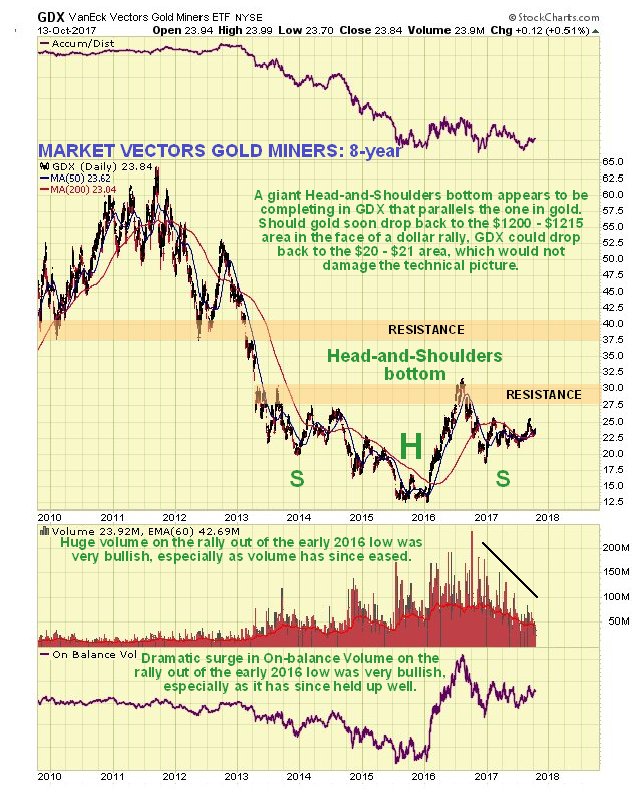
The Market Vectors Gold Miners, GDX, which functions as a gold stocks index, is marking out a giant Head-and-Shoulders bottom that roughly parallels the one completing in gold itself. A near-term decline to $20$21 in GDX will be viewed as presenting another important buying opportunity for the sector. The volume pattern during the build out of this base pattern is very bullish, with big volume on the rise out of the low (Head) of the pattern, tailing off steadily as the Right Shoulder has formed.
A mistake commonly made by gold and silver bugs, especially those close to or involved in the mining industry is to become "wed" to the sector to the exclusion of most everything else. This habit has ruined a good many investors in the Precious Metals sector in recent years. Investing should be regarded as an "opportunity cost game," where you seek always to maximize your returns within a given time frame consistent with an acceptable level of risk. This is the philosophy on clivemaund.com, which is why we made a detour into the marijuana sector last year ahead of the legalization votes, when it boomed, and why we have invested in a variety of different sectors and stocks this year, notably the Biotech and Medical sector. There is no need to wait around on the Precious Metals sector to start a major uptrend, when, apart from individual outstanding opportunities in the sector than can occur at any time, it is possible to go with whatever is performing in the here and now.
We have had a number of outstanding successes in recent months and weeks where we traded on the basis of some very clear and useful chart patterns and signals, and a number of our stocks have produced some classic examples of chart patterns involving different types of candlesticks and price and volume patterns, often in combination, in the recent past. There is one in particular that I would like to draw your attention to in CHART SCHOOL Gravestone Doji and Parabolic Blowoff calls a top, where just on the one chart going back 4-months we see a dramatic confluence of different factorscandlesticks, parabolic slingshot, various oscillators and the volume pattern all calling a top RIGHT NOW for a particular stock, and this also provides examples of breakaway gaps and a Flag. We sold this stock on Friday. To take a look at its chart, all you have to do is click on the link above, and for a good measure a couple of other interesting chart examples that we traded are included in this article, which is intended to be educational.
Hope you like what you see.
Clive Maund has been president of www.clivemaund.com, a successful resource sector website, since its inception in 2003. He has 30 years' experience in technical analysis and has worked for banks, commodity brokers and stockbrokers in the City of London. He holds a Diploma in Technical Analysis from the UK Society of Technical Analysts.
Want to read more Gold Report articles like this? Sign up for our free e-newsletter, and you'll learn when new articles have been published. To see recent articles with industry analysts and commentators, visit our Streetwise Interviews page.
Disclosure:
1) Clive Maund: I, or members of my immediate household or family, own shares of the following companies mentioned in this article: None. I personally am, or members of my immediate household or family are, paid by the following companies mentioned in this article: None. My company has a financial relationship with the following companies referred to in this article: None. I determined which companies would be included in this article based on my research and understanding of the sector.
2) The following companies mentioned in this article are sponsors of Streetwise Reports: None. Streetwise Reports does not accept stock in exchange for its services. Click here for important disclosures about sponsor fees. The information provided above is for informational purposes only and is not a recommendation to buy or sell any security.
3) Statements and opinions expressed are the opinions of the author and not of Streetwise Reports or its officers. The author is wholly responsible for the validity of the statements. The author was not paid by Streetwise Reports for this article. Streetwise Reports was not paid by the author to publish or syndicate this article.4) The article does not constitute investment advice. Each reader is encouraged to consult with his or her individual financial professional and any action a reader takes as a result of information presented here is his or her own responsibility. By opening this page, each reader accepts and agrees to Streetwise Reports' terms of use and full legal disclaimer. This article is not a solicitation for investment. Streetwise Reports does not render general or specific investment advice and the information on Streetwise Reports should not be considered a recommendation to buy or sell any security. Streetwise Reports does not endorse or recommend the business, products, services or securities of any company mentioned on Streetwise Reports.
5) From time to time, Streetwise Reports LLC and its directors, officers, employees or members of their families, as well as persons interviewed for articles and interviews on the site, may have a long or short position in securities mentioned. Directors, officers, employees or members of their immediate families are prohibited from making purchases and/or sales of those securities in the open market or otherwise from the time of the interview or the decision to write an article, until one week after the publication of the interview or article. As of the date of this interview, officers and/or employees of Streetwise Reports LLC (including members of their household) own securities of Reliq Health Technologies, Helius and Blue Moon Zinc, companies linked in this article.
Charts provided by the author.


