


The war drums are beating. This has driven gold higher and the June lows look like a classic bottom.
Think about it. Gold had been dribbling down all year, but when the Fed began its tapering talk in mid-June, it pushed gold down to new lows.
The already bruised gold price broke down, plunging to the $1,200 area in late June, only to zip back up above $1,300 four weeks later.
Funds were then quick to cover their record shorts, while net long positions jumped way up.
Plus, with gold at extreme oversold levels, the most since 2008, the downside was limited.
In fact, we don't think gold was as hated in 2008. . .a ripe situation for the strong pop up we've recently had.
But we're not out of the woods yet, and we could see more sluggishness. Nevertheless, the market is poised to rise further, which will likely coincide with the escalation in Syria.
Why gold is not yesterday's paper
The Asian markets took advantage of gold's $700 fall in almost two years and bought gold. . .a lot of it. And this together with the Fed's ongoing stimulus program helped contribute to the bottoming action.
In the end, the price tells all, and the rest is noise and distraction. And gold's price today is desirable in the big picture.
We all know the monetary stimulus by the Fed, and other central banks, is very bullish for gold because the end result is inflationary.
This is one key reason why China, Asia in general, and India have been buying up gold. They see how cheap it is and they're taking advantage of it, just like we want you to do. We are too.
GOLD TIMING: Intermediate lows at hand
For now, it sure looks like the decline we call D is over. And the more time passes, the more likely the closing low at $1211.60 on June 27 was THE low.
Just looking at the indicators, you can see why. The extreme D low on Chart 1B shows a bottom forming in this extreme area. This has become a springboard for an intermediate rise, we call A.
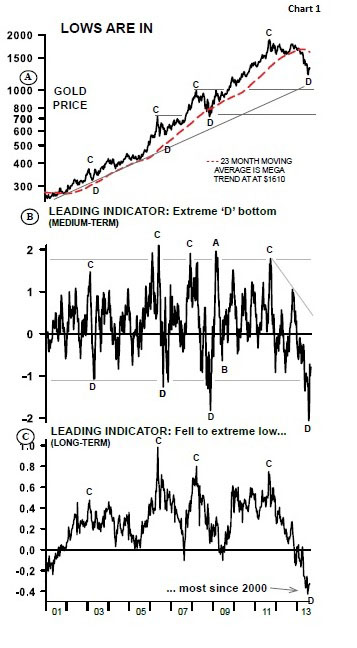
Plus, with the long-term indicator also at an extreme low, it reinforces this springlike formation (see Chart 1C).
Again, today's low level is giving us a good opportunity to buy at good prices. . .and we recommend taking advantage of it.
For now, watch these stepping stone levels on the way up...
If gold can rise and stay above $1,400, it'll mean that it could jump up to the $1,500-$1,565 level.
After that we have the $1,700, $1,800 and $1,900 levels to surpass before getting to record highs.
Overall, however, the current rise will tell us a lot about the strength (or weakness) of the gold market. If it doesn't hit a new record high, it'll be a first for the entire bull market and a clear bearish sign.
If a record high is eventually reached, gold will be signaling that the bull market is ongoing and it's strong, in spite of the almost two year correction that took 36% away from the bull market.
We're watching this closely!
Mary Anne and Pamela Aden
The Aden Forecast
Mary Anne & Pamela Aden are well known analysts and editors of The Aden Forecast, a market newsletter named 2010 Letter of the Year by MarketWatch, which provides specific forecasts and recommendations on gold, stocks, interest rates and the other major markets. For more information, go to www.adenforecast.com


