

"History does not repeat itself, but it often rhymes", as Mark Twain noted.
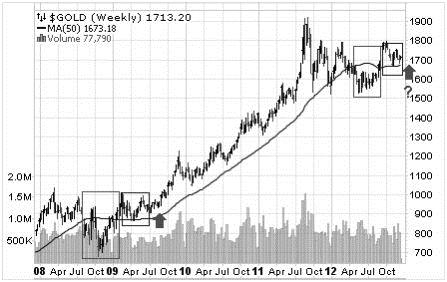
Featured is the five year weekly gold chart. The green boxes highlight pullbacks from overbought conditions. The blue boxes show the testing of a breakout from below the 50 week moving average. The green arrows point to the expected upward direction upon the completion of this test.
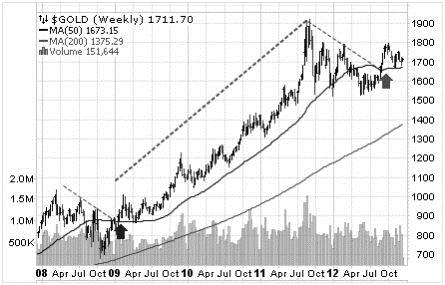
Featured is the same chart with the focus on the upside breakouts from beneath the 50WMA. The blue arrow points to the last breakout in early 2009. The green line highlights what happened to the gold price upon that breakout. The green arrow points to a similar setup.
"In the absence of the gold standard there is no way to protect savings from confiscation through inflation. There is no safe store of value without gold. This is the shabby secret of the welfare statists versus gold. Deficit spending is simply a scheme for the hidden confiscation of wealth. Gold stands in the way of this insidious process that stands as a protector of property rights"....Alan Greenspan in 1966.
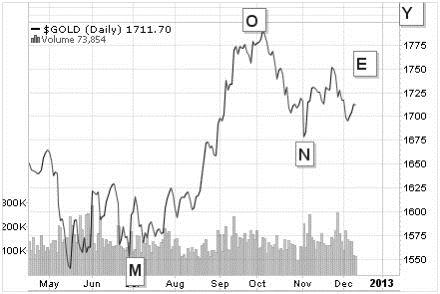
Featured is the daily gold chart. In its simplest form this chart spells 'MONEY'. During the last gold bull market gold rose from $35.00 to $850.00for a 24-fold increase. A similar increase from the low point in 2001 ($260.00), sets up a target of $6,240.00.
"Every minute of every day the central bankers of the world print 2 million dollars worth of currency". ...Jim Grant
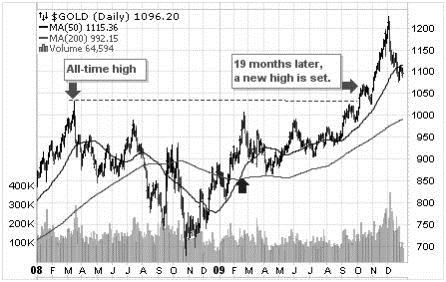
Featured is a 'look back' at a gold chart between 2008 and 2009. The first green arrow points to the record high gold price reached during March of 2008. The blue arrow points to the upside breakout of the 50DMA rising above the 200DMA. The second green arrow points to a new record high price for gold in October of 2009. It took 19 months for the new high price to occur.
"Gold is the soul of all civil life. It can resolve all things to itself and turn itself into all things." Samuel Butler (British author 1835 1902).
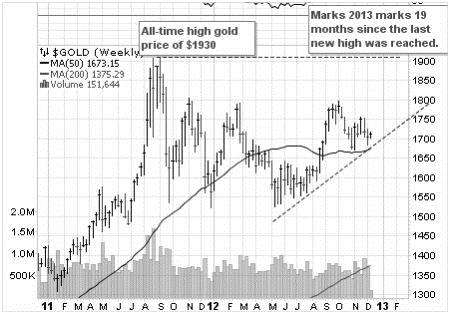
Featured is the weekly gold chart for the past two years. The last all-time high price ($1930) happened in August of last year. Moving forward by 19 months (see previous chart), brings us to March 2013. This is not a guarantee that the new high in gold will be reached during March, but the average gold correction of 10% or more has resulted in a delay of 12 19 months before a new record high was established.
During the 'Dot-com' bull market Nortel rose from pennies to $125; Cisco to 82.00; Yahoo to $127; and Microsoft to $60. All four were based on a 'concept'. By comparison 'gold is money!'
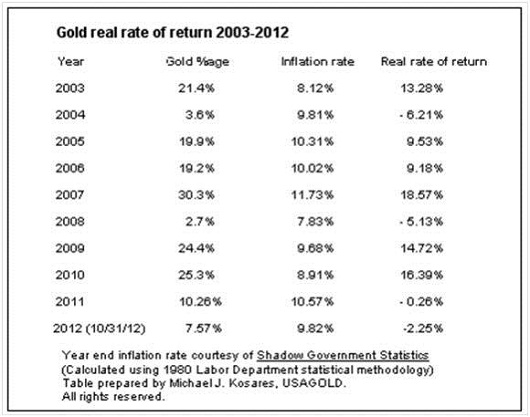
This table courtesy Michael J. Kosares show the 'real rate of return' of gold since 2002. The first column shows the steady annual increase and the third column shows the rate of increase after the rate of inflation has been deducted.
Gold closing price at last day of the year: 2000 = $274; 2001 = $279; 2002 = $348; 2003 = $416; 2004 $ $439; 2005 = $519; 2006 = $638; 2007 = $838; 2008 = $889; 2009 = $1097; 2010 = $1420; 2011 $ 1566; 2012 (so far $1710).
Happy trading!
Peter Degraaf
www.pdegraaf.com
DISCLAIMER: Please do your own due diligence. I am NOT responsible for your trading decisions.
© 2012 Copyright Peter Degraaf - All Rights Reserved


