

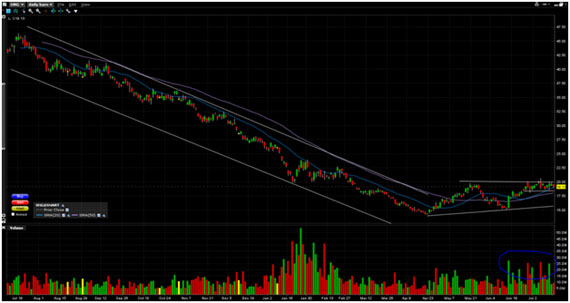
Nat gas (UNG) has recently caught my attention. While it was in a significant downtrend for the better part of a year it has recently been consolidating right under the $20 level. A look at the daily chart shows a long move down and then recently a sideways consolidation pattern. While this is typically a continuation pattern I am beginning to believe think that the next move may be up rather than an extension of the previous down trend.
- Over the last two weeks there been significant support above $18 and significant volume.
- The $20/$20.50 level has been tested multiple times and the more tests it undertakes the more likely it is to break.
- Both the 20-day and 50-day moving averages have turned upwards and UNG is trading above both.
If we zoom in a bit and take a look at the hourly chart we are presented with two scenarios:
- The rising wedge holds and UNG breaks through the $20 - $20.50 resistance level on high volume and a new long term up trend is produced
- The head and shoulders pattern within the wedge breaks downwards and the downtrend resumes
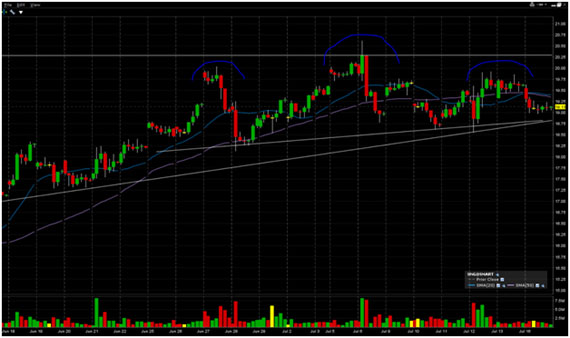
I'm leaning towards option one but will be waiting for a breakout confirmed with volume in either case.
Chris Vermeulen
www.GoldAndOilGuy.com
Related Articles


