

There is another important factor left out of the research train of thought, however, and that is cost of production. We have to be careful to get this right or we could end up comparing apples to oranges. Therefore, to complete this line of reasoning, we have to consider the profitability factor. Cash costs are confusing across the industry because they are not standardized. Royalties and other factors vary from company to company and lease to lease.
From the World Gold Council Site:
"Environmental considerations require that mined gold must be 'replaced' as part of the mining process. The average cost of replacing and producing an ounce of gold rose to $928/oz in 2010, from $282/oz in 2001, and it continues to climb, according to Metals Economics Group."
So total cost climbed $646/oz in nine years, which averages out at $71.77 per annum. I will take this on face value and therefore assume $999.77 for 2011 and $1,071.54 for 2012 additions to this linear progression. (Assumption: I know this is a dangerous practice, however I am generalizing on this theory at the macro level for the sector, therefore this provides the best estimation possible.)
By linear progression I mean to say the averaged cost increase for the industry applied equally each year as follows in the table below. I know this is not a perfect system and that costs moved slower in the early years of the rally however this is for illustrative purposes. I believe the averaged figure still serves a purpose for this exercise because it adds understanding of the principles.
Here is a table that accounts for total costs and adjusts for the AUD and our market. As you see we are only just beginning to get into a profitable area. If the world wants companies to mine gold then they have to get used to higher prices.
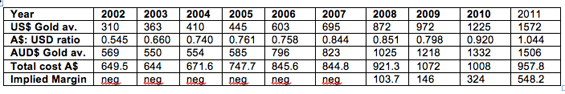
Notes:
- US$Gold is an annual average like the A$:USD ratio and Total cost.
- Total cost has been adjusted using the average AU$:US$ ratio and so has AUD$Gold av for the year.
- The Total cost figure includes the cost of replacing ounces and all costs. However, it is obvious that capital raisings and lower exploration budgets were used by the majors to minimize their costs, and hence stay in business. In fact, mergers and acquisitions were used to replace ounces in the ground against mining depletion due to the lack of large gold discoveries. This is a phenomenon that continues to this day.
These figures do not necessarily reflect accurate numbers for the each year or the extremes during any of these years or for individual stocks yet they do indicate longer term (annualized) profitability industry averages over time much like a long term indicator on any index. The effect is a smoothed long-term average.
It is also noteworthy that I have used industry average total costs on a global basis yet costs in Australia tend to be higher due to wage inputs. Accounting practices and reinvestment also affect total costs on an individual company basis. The numbers are important as a guide when we look at the sector macro view. Once I explain the coming investment focus as a return to an old model you will see how important this is.
Conclusions:
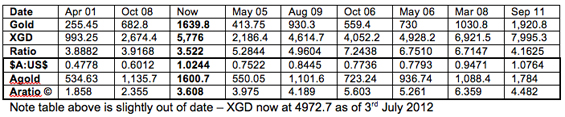
Now I come to my point, and that is the high in A-ratio for September 2011 was either an anomaly or gold has to crash. A reading of only 4.482 as a high at that gold peak compares to averages of around 6 in earlier periods of the gold rally to date. Non-performance of the gold sector compared to gold at a market high can mean the temporary end of a trend. I saw this in April to May 2006. In May 2006 the Aratio topped at a lacklustre 5.261, which was hardly inspiring at the time. The gold stocks topped in early April.
I believe the poor sentiment on the Australian equities sector has been the main cause of the lacklustre gold stock action into the 2011 gold high. This is a time of extreme global markets running on spin and a lack of fundamentals. I also consider the high Australian dollar up around those 1.10 levels and to a lesser extent at parity or just above would have held back some offshore capital from entering. Our sovereign risk rating has suffered to some degree thanks to the MRRT and a minority government with the Green Party being antimining; these factors may not have helped. The MRRT, however, does not include gold.
The current reading of just 3.608 (table above) is a massive distortion of biblical proportions when you factor in that these stocks are only now in a profitable situation. It is always about the money when it comes to share price and the gold stocks are the generators of growing cash flows in a low-growth world struggling to find yield. When we compare the current profitability to the lousy share price performance, the contrarian in us should start to get very excited.
From my table you can see that real gold stock margins only began to gain traction over total costs in 2008 when the average price was applied with the average AU$:US$ ratio. These figures were distorted at the lows and by those lows due to the exceptional volatility. When you average 2008 down to months you would find a shaky picture and great risk. The 2009 figures were more representative of an initial real margin for the industry as a whole throughout the course of the year, however the margin provided little buffer. In 2010 and finally 2011 we have witnessed a watershed era for gold stocks in terms of profitability and it was not accompanied by strong share price rises for most companies, however there will be a catch up if this gold strength continues. I believe it will more than continue.
The profitability has been overlooked by investors that think they see a spike in gold and fear that this is a major top for gold. I want to draw your attention to the fact that gold stocks have become cash generators in real terms for the first time of the gold bull in 2010 and 2011. This happened to coincide with very poor sentiment for the industry and equities as an asset class. This has trashed the sector setting us up for a massive rally once sentiment changes. The lows are very significant at this time especially when you consider this added layer of research on margins.
Now I would like to take this research a step further and factor in the profitability of the sector. The average industry total cost includes all administration, corporate costs, development, maintenance, rehabilitation and replacement of reserves. It is now estimated to be circa US$1,071.54 based on an average US$71.77 increase per annum. Now this needs to be adjusted to establish an average margin for 2012. To achieve this I factored an average AU$:US$ and average AU$POG for this yearwhich I based on a 200-day moving average for each.
The 200-day moving average (DMA) for the AU$:US$ is currently sitting at 1.0256 and we have had around 180 days this year so far so near enough to use the 200 DMA. The average USD gold price, by this measure is sitting at $1,662 Adjusting the gold price to an average AU$POG is $1,662 / 1.0279 = AU$1,616.90 per ounce of gold. Using the average exchange rate we can also calculate the average total cost for the industry in AUD terms. US$1,071.54 / 1.0279 = AU$1,042.45
The most appropriate way to measure apples to apples here is to calculate the margin as a percentage of the total cost x 10. I call this a Pratio, which stands for Profitability ratio. Here is the calculation: Implied Margin ÷ Total cost AU$ (as a decimal) x 10 = Pratio
An example is:
2008: 103.7 ÷ 921.3 = 11.25% = 0.1125 (expressed as a decimal)
0.1125 x 10 = 1.125 = Pratio
In order to relate this back to the Aratio and value it according to the profitability of the sector I have decided to take the Aratio (which measures the gold price compared to the XGD) and divide it by the Pratio. Thus we get: Aratio ÷ Pratio = GOzV
This final figure provides a relative value for the sector that takes into account the AU$POG, the level of the XGD (index of gold stocks) and the profitability of the sector. This creates a true valuation that combines all of the variables we grapple with. This GOzV figure can be measured retrospectively to check prior peaksand at the same time it shows us exactly how cheap or dear the stocks are based on profitability compared to gold and the share price right now.
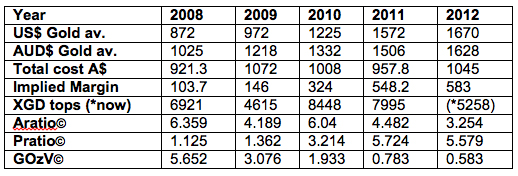
For gold stocks to reach the levels last seen in the peak in early 2008 they would have to rise approximately tenfoldi.e., current GOzV is 0.583 x 10 = 5.83 compared to the 2008 high of 5.652.
Business Model to Reemerge
During the early 80s when things turned sour in the business climate the Australian stock market made lows of 450 on the XAO. At that time we saw rising defaults and a recession along with opportunistic business operators who bought companies and split them up. They kept the cash flow segments of these businesses and sold off the rest. Cash flow was king and cash was king; just where we are right now.
Bankers and finance workers are looking for ways to maintain their lifestyles and gain traction themselves in a slowing global economic climate. Old-growth models that predate the secular bull in paper assets are once again becoming relevant today. This is because the growth model that post dated this time in history was turbo charged by debt.
People borrowed and spent, so did companies and corporations and governments. It was the beginning of the "greed is good" 1980s. However, it all started with the cash is king / cash flow is king condition. For the next few years the smart investors will be chasing yieldit is no longer there in the bond markets and they are already starting to turn to stocks.
The only problem to date is that some of the funds have not woken up to the fact that things are not going back to normal. So many bad choices are being made on stock selection. You do not have to invest in gold stocks: Iif you can find a stable yield through the coming times and the balance sheet of that company is sound, then you are highly likely to do well.
Fortunes were made in the early '80s and they will be again today. Deleveraging will remain in force for at least a decade given the size of the task at hand, probably two. The longer the authorities balk at natural market forces by trying to print their way out the worse it will become. The longer it will take to turn this around. The severity of the pain just increases because they dont want to take the medicine on their watch. Yet the time has long passed where a dollar of stimulus created any decent return in terms of growth.
As gold picks up and resumes its uptrend towards my next target circa US$2,100, perhaps this year investors will realize once again that they were wrong-footed. It will not come with good news, quite the opposite. The chase for a yield as opposed to capital gains will become the focus for more investors and the risk in the currencies will create volatility in foreign exchange.
The gold stocks will launch on their next run up to at least an Aratio of 6 from here and that equates to an XGD reading of 12,000 with gold $2,100 x 6 (Aratio). We are currently sitting at approximately 5,000 so I expect it to more than double. Some stocks will outperform as usual. Maximum leverage will be gained by those investors willing to buy when there is blood in the streets and the sector is hated and we are about there now in my opinion.
Good trading / investing.
Neil Charnock
www.goldoz.com.au
GoldOz has now introduced a major point of difference to many services. We offer a Newsletter, data base and gold stock comparison tools plus special interest files on gold companies and investment topics. We have expertise in debt markets and gold equities which gives us a strong edge as independent analysts and market commentators. GoldOz also has free access area on the history of gold, links to Australian gold stocks and miners plus many other resources.
Neil Charnock is not a registered investment advisor. He is an experienced private investor who, in addition to his essay publication offerings, has now assembled a highly experienced panel to assist in the presentation of various research information services. The opinions and statements made in the above publication are the result of extensive research and are believed to be accurate and from reliable sources. The contents are his current opinion only, further more conditions may cause these opinions to change without notice. The insights herein published are made solely for international and educational purposes. The contents in this publication are not to be construed as solicitation or recommendation to be used for formulation of investment decisions in any type of market whatsoever. WARNING share market investment or speculation is a high risk activity. Investors enter such activity at their own risk and must conduct their own due diligence to research and verify all aspects of any investment decision, if necessary seeking competent professional assistance.


