

Looking at the market from a "herd" mentality and seeing everyone run to buy more stocks for their portfolios has me on edge. We could see a strong wave of fear/selling hit the S&P 500 index over the next two weeks, catching the masses with their hands in the cookie jar. . .again.
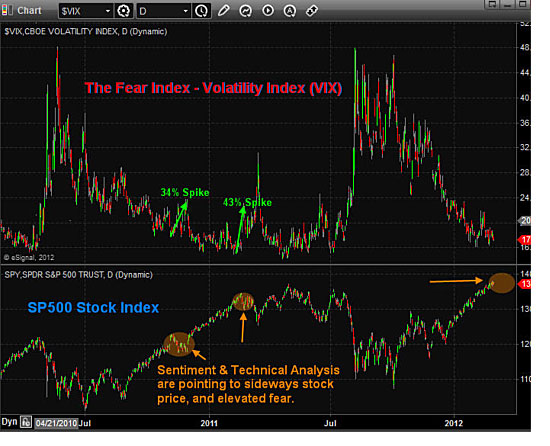
If you dont know what the volatility index (VIX) is, then think of it as the fear index. It tells us how fearful/uncertain investors are or how complacent they are with rising stock prices. Additionally, a rising VIX also demonstrates how certain the herd is that higher prices should continue.
The chart below shows this fear index on top with the SP500 index below, and the correlation between the two underlying assets. Just remember the phrase: "When the VIX is low its time to go; when the VIX is high its time to buy".
Additionally, the volatility index prices in fear for the next 30 days, so do not be looking at this for big picture analysis. Fear happens very quickly and turns on a dime so it should only be used for short-term trading, generally 3-15 days.
Volatility Index and S&P 500 Correlation and Forecast Daily Chart
Global Issues Continue to Grow, but What Will Spark Global Fear?
Everyone has to admit the stock market has been on fire since the October lows of last year, with the S&P 500 index trading up over 26%. It has been a great run, but is it about to end? Where should investors focus on putting their money? Dividend stocks, bonds, gold. . .or just sit in cash for the time being??
I may be able to help you figure that out.
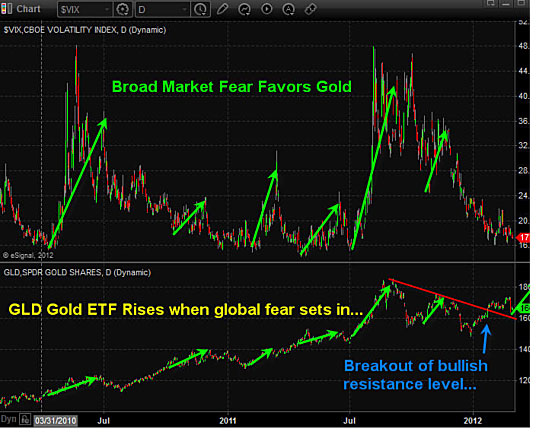
Below is a chart of the volatility index and the gold exchange-traded fund, which tracks the price of gold bullion. Notice how when fear is just starting to ramp up gold tends to be a neutral or a little weak. But not long after investors start selling their shares of securities, we see money flow into the shiny yellow safe haven.
Gold and Fear Go Hand-in-Hand: Daily Chart
Looking at the relationship between investor fear/uncertainty and gold, you will notice scared money has a tendency to move out of stocks and into safe havens.
Trading Conclusion: Looking Forward Three Months. . .
In short, I feel the financial markets overall (stocks, commodities and currencies) are going to start seeing a rise in volatility, meaning larger daily swings that inherently increased overall downside risk to portfolios and all open positions.
To give you a really basic example of how risk increases, look at the daily potential risk the S&P 500 can have during different VIX price levels:
Volatility index under 20/Low Risk: Expect up to 1% price gaps at 9:30 a.m. ET, and up to 5% corrections from a previous high.
Volatility index between 20-30/Medium Risk: Expect up to 2% price gaps at 9:30 a.m. ET, and up to 15% corrections from recent market tops or bottoms.
Volatility index over 30/High Risk: Expect 3+% price gaps at 9:30 a.m. ET, and possibly another 5-15% correction from the previous VIX reading at medium risk.
Note on price gaps: If you dont know what I am talking about, a price gap is simply the difference between the previous days close at 4 p.m. ET and the opening price at 9:30 a.m. ET.
To continue on my market outlook, I feel the stock market will trade sideways or possibly grind higher for the next one to two weeks. During this time volatility should trade flat or slightly higher because it is already trading at a historically low level. It is just a matter of time before some bad news hits the market or sellers start to apply pressure. and either of these will send the fear index higher.
I hope you found this info useful. If you would like to get these reports free every week delivered to your inbox be sure to join my free newsletter here: www.GoldAndOilGuy.com
Chris Vermeulen, The Gold and Oil Guy


