

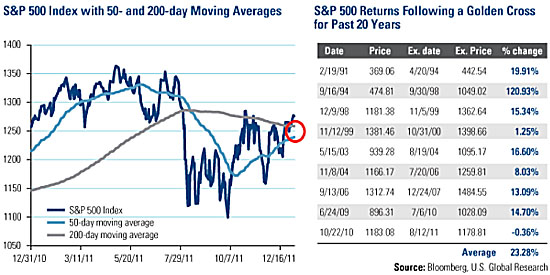
Like sprinkler systems, some traders have automatic triggers that initiate the buying or selling of blocks of stocks. One trigger where we generally see money move in and out of the market is based on the golden cross, which identifies when the 50-day short-term average crosses above the 200-day long-term average of a stock or index. Youll find that many charts on Yahoo, Google, Bloomberg or other financial websites default to show this information along with the performance.
Theres a good historical reason traders use this mechanical trigger. Over the past 20 years, the 50-day line crossing above the 200-day average of the S&P 500 index resulted in surprisingly bullish data. Of the nine times this event has occurred in those 20 years, the S&P 500 averaged a 23% increase before the market reversed.
One extraordinary example is the golden cross that occurred in September 1994, which resulted in a whopping 120% increase by the time the trend reversed in September 1998!
The lone exception to this trend was the unusual and very volatile market in 2010-2011. Even then, the S&P 500 only lost a third of a percent.
Today, the S&P 500 is only about one and a half percentage points away from the golden cross. With the index already above the 200-day moving average, the 50-day is on a path to continue rising. Perhaps this might encourage investors to "cross the street" now and anticipate the automatic trigger before traders act.
During our 2012 Outlook webcast, we discussed many market indicators to give you an idea of what to expect this year. If you missed the discussion, click here to listen to the webcast replay now.
Frank Holmes, U.S. Global Investors
The S&P 500 index is a widely recognized capitalization-weighted index of 500 common stock prices in U.S. companies.
All opinions expressed and data provided are subject to change without notice. Some of these opinions may not be appropriate to every investor.


