

I have been following a fractal (pattern) on the Dow chart for the last couple of years. I have written about it before, in a previous article. Basically, the Dow chart is forming a similar pattern to that which formed in the late '60s to early '70s.
If this pattern continues in a similar manner to that of the late '60s to early '70s pattern, the Dow could indeed have an annus horribilis (horrible year). Below, is a long-term chart of the Dow:
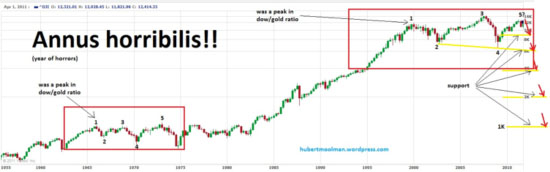
I have highlighted two fractals on the chart. I have also indicated five points on both fractals to illustrate how they could be similar. Point 1 on both fractals was the exact point at which the Dow:gold ratio made a significant peak. This is an important marker, and it gives credibility to the comparison of these two patterns.
It appears that the Dow is currently searching for that point 5. Point 5 could already be in, or it could be a little higher than the recent high (of 12,928). However, from a timing point of view, it is likely that we have reached point 5 already (a retest could still be possible).
If the current fractal continues its similarity to the late '60s to early '70s fractal, the Dow could have a horrible drop for most of 2012. I do not wish to speculate as to how low it will go; however, if it stays exactly true to the past fractal (fractals do not always stay exactly true), it could drop to 6,000.
Since my other analysis suggests that we are at the end of era (an era of the corrupt debt-based monetary system), I would really expect the worst-case scenario. That means that a drop to 1,000 is very possible (not necessarily in 2012), even though it appears highly unlikely.
The Dow's inflated value, relative to the value of gold, was brought about by this debt-based monetary system. It follows naturally that in the event of the debt-based monetary system collapsing (it will eventually); the Dow:gold ratio could go back to levels prior to the introduction of this system. This level could be anywhere between 0.2 and 1, in my opinion. Therefore, it is possible to have a gold price of $5,000/oz, with the Dow at 1,000. I do not say that we will have these levels, but it is certainly possible. All I am saying is that we have to be prepared for extremes never before seen in our lifetime.
In addition, I have written before of how similar today's conditions are to that of the Great Depression. Based on that analysis, todays economic fundamentals certainly support the theory of a massive drop in the Dow, relative to gold and even the U.S. dollar.
Now, if you think that gold cannot rise when the Dow has a massive drop as suggested above, then you should look at the following chart and think again:
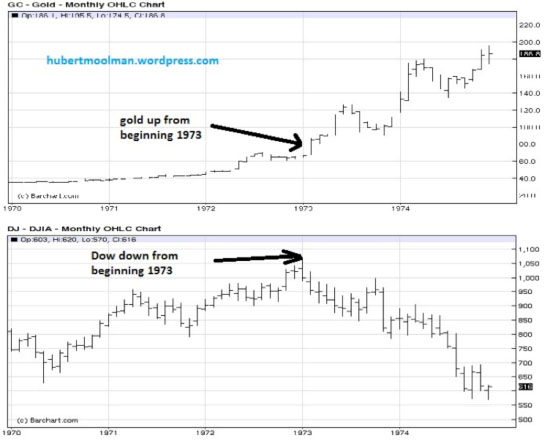
I have compared the gold chart (top) from 1970 to 1975 to the Dow chart (bottom) for the same period. From the beginning of 1973, the Dow started a massive drop, while gold started a huge rally. Furthermore, the beginning of 1973 happens to be the same point as point 5 in the first chart.
From a short-term perspective, the Dow:gold ratio is "overbought," and could drop significant lower over the coming months. Below is a three-year chart of the Dow:gold ratio:
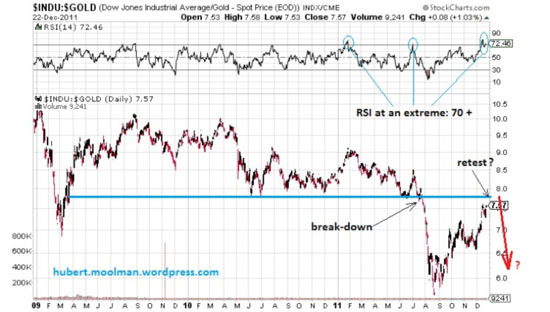
On the chart, I have drawn a possible blue support line, which now could be resistance. It appears that the ratio broke down from that support in July of this year, and is now in the process of retesting that break-down point. The RSI seems to be at a three-year extreme, and suggests that upside potential from here could be limited. If the ratio turns around now, or closer to that blue line, it could fall very fast.
Gold appears to be at a very critical point of the bull market. See the chart below:
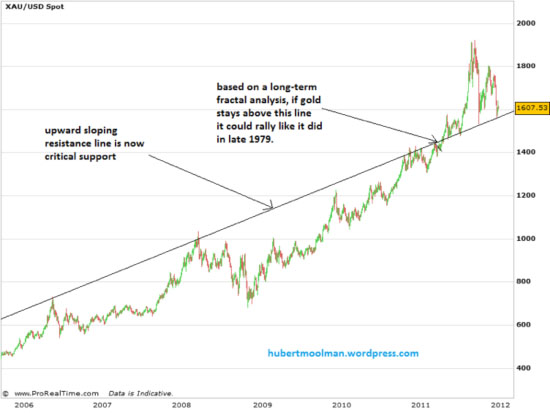
The gold price is currently holding just above the upward-sloping line. Based on my long-term fractal analysis, this line is a critical area, and should price rebound form this line; it could rally like it did in late 1979.
For more detailed gold and silver analysis please visit my website. I have also recently completed a detailed fractal analysis report for gold and silver.
Warm regards and God bless, Hubert
http://hubertmoolman.wordpress.com/
[email protected]


