

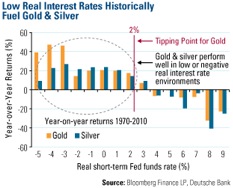
This will likely translate to the real interest rate (which is the rate of interest an investor can receive on a U.S. Treasury bill after allowing for inflation) remaining negative for at least another year and a half.
For gold investors, a low-to-negative interest rate has been associated with a powerful historical trend. Going back four decades, gold has experienced positive higher year-over-year returns whenever the real interest rate tipped below 2%. And the lower the rates drop, the stronger gold tends to perform.
Marc Faber, editor of the Gloom Boom & Doom Report, believes the Fed will keep rates near zero even longer than 2013. In his November commentary, he points to the opinion of Chicago Federal Reserve Bank President Charles Evans, who wants the Fed to "commit itself to keep short-term rates at zero until the unemployment rate falls below 7% or the outlook for inflation over the medium term goes above 3%." If Evans has his way, Dr. Faber extrapolates that rates could "stay at zero for five or even 10 years (and negative in real terms)." Based on Dr. Doom's prediction, one could infer that gold could continue its bull run for several years to come.
This rate-cutting trend is not only an American phenomenon, as other countries have been slashing their interest rates. In surprise moves, the central banks of Europe, Brazil, Indonesia and Turkey have all recently cut rates. This week, the European Central Bank surprised markets when it cut its key interest rate by 0.25%. Brazil has cut rates twice over the past two months, and Turkey cut its benchmark interest rate a few months back as part of an unorthodox move to keep its economy from overheating.
Many investors follow the Fed's decisions, but to see countries' rate changes in action over the years, The Wall Street Journal
put together an interesting interactive showing how countries around the world have increased or decreased their interest rates over the past several years. Check it out now.
The other strong action central banks have been taking is loading up on gold. In "Perfect Storm Creates Tidal Wave of Gold Demand," we discussed how the trend of gold buying by central banks in the East has been increasing while the Western central banks have ceased selling their gold. Now Turkey's central bank is trying to manage liquidity in the banking system by allowing banks to keep up to 10% of their required reserves against lira liabilities in gold.
Bloomberg News reported that if Turkish banks fully allocate that 10%, it will free up $3.1 billion in liquidity.
This has followed a similar move by Turkey's central bank to allow private banks to hold an increased percentage of their reserves against foreign-currency liabilities. Since that change, 21.6 tons of gold were added. According to Bloomberg News, another 55 tons of gold could be added after the new adjustment goes into effect on November 11. This would bring the total gold reserves in the Turkish central bank to a value of $10 billion.
'Tis the Season for Gold
Combine the central bank purchases of gold with the fact that we are now entering the strongest months of the year for gold. The chart from Bank of America Merrill Lynch (BofA) below shows how gold and gold equities have performed on an average monthly basis over the past 10 years. While the spot gold price has differed from the S&P/TSX Composite Index of gold equities during the first 10 months of the year, their historical pattern is very similar during the last two months. November has historically been the strongest month of the year for gold equities, with mining stocks increasing 8.1%.
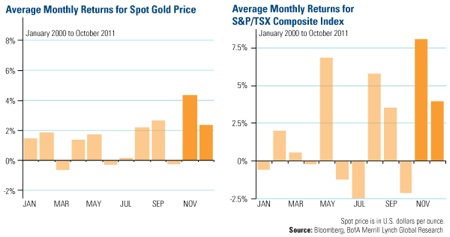
Combined with equity valuations at historically low levels, BofA believes, "gold equities could follow the historical pattern in late 2011."
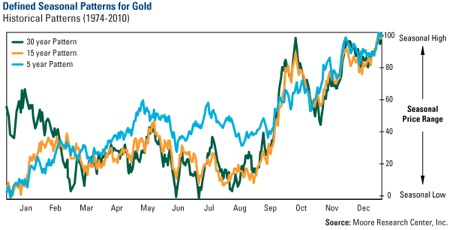
The argument for a rally in gold and gold equities this time of year is strengthened when we compare the seasonal patterns over different time frames. I often show gold's historical patterns when I present my Goldwatcher Presentation to emphasize how strong these last months of the year have been over every time period.
The five-year pattern has strayed from the longer-term historical patterns, particularly before the October timeframe. For the past five years, the gold price has started the year weak, and then moved considerably higher than its 15 and 30-year historical average from February through September.
However, over the 5, 15 and 30-year patterns, the trends in November and December have mimicked each other.
BofA says a key driver of this late-year gold trend has been increased jewelry demand for the Christmas buying season. We agree wholeheartedly, as the gift-giving season around Christmas drives many consumers to purchase gold jewelry for their loved ones. And despite consumer sentiment remaining near a record low, the National Retail Federation anticipates holiday sales rising a modest 2.8% this November and December.
In India and China, people are especially amorous of the metal and buy gold out of love. It is customary in most developing countries to give gold as a gift to friends and relatives for birthdays, weddings and to celebrate religious holidays. And this time of year, gift giving in the form of gold is especially strong in India. Indians recently celebrated Diwali, which spurs gold buying during a five-day celebration of good over evil, light over darkness, and knowledge over ignorance (Read the Frank Talk post on Diwali). Diwali is followed by the main Indian wedding season where many Indians will be buying golden gifts for the bride and the groom. In China, 2012 is the "Year of the Dragon" and retailers expect to sell gifts in the form of gold dragon jewelry, pendants, statues and coins.
Gold investors should remember that volatility swings both ways. If you look at 10 years of data, gold bullion has had 10% price swings about 7% of the time. These 10% swings are more common for gold equities, as the NYSE Arca Gold BUGS Index has had 10% swings over 20 trading days about a third of the time.
With three drivers1) negative real interest rates propelling investors to seek gold for it's perceived "safe haven" qualities, 2) the Love Trade in full bloom, and 3) central banks increasing their holdings in the yellow metal—happening over the next two months, gold is one commodity that could benefit.
U.S. Global Investors, Inc. is an investment management firm specializing in gold, natural resources, emerging markets and global infrastructure opportunities around the world. The company, headquartered in San Antonio, Texas, manages 13 no-load mutual funds in the U.S. Global Investors fund family, as well as funds for international clients.
For more updates on global investing from Frank and the rest of the U.S. Global Investors team, follow us on Twitter at www.twitter.com/USFunds or like us on Facebook at www.facebook.com/USFunds. You can also watch exclusive videos on what our research overseas has turned up on our YouTube channel at www.youtube.com/USFunds.
The NYSE Arca Gold BUGS (Basket of Unhedged Gold Stocks) Index (HUI) is a modified equal dollar weighted index of companies involved in gold mining. The HUI Index was designed to provide significant exposure to near term movements in gold prices by including companies that do not hedge their gold production beyond 1.5 years. The S&P/TSX Composite Index is a capitalization-weighted index designed to measure market activity of stocks listed on the TSX.
All opinions expressed and data provided are subject to change without notice. Some of these opinions may not be appropriate to every investor. By clicking the links above, you will be directed to third-party websites. U.S. Global Investors does not endorse all information supplied by these websites and is not responsible for their content.


