For all of 2010, we ran a $265.12B deficit just from petroleum. That is equivalent to the more than half combined market capitalizations of all the 208 firms in the Zacks Oil Exploration and Production Industry! That group includes firms like Apache (APA - Analyst Report), Anadarko (APC - Analyst Report) and Devon (DVN - Analyst Report).
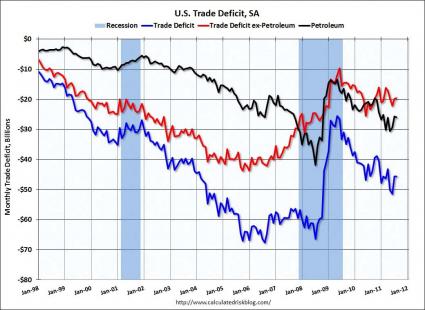
The graph below (from http://www.calculatedriskblog.com/) breaks down the deficit into its oil and non-oil parts over time. It shows that the overall trade deficit (blue line) deteriorated sharply from 1998 to mid-2005 and then remained at just plain awful levels until the financial meltdown caused world trade to come to a screeching halt.
That caused a major but unfortunately short-lived improvement in the overall deficit. However, the stabilization in the non-oil deficit started about two years earlier, but that was offset by the effects of soaring oil prices which caused the oil side of the deficit to deteriorate sharply.
The Oil Side
For the month, the oil deficit deteriorated slightly, rising by 1.24% to $26.06B, and was up from a year ago by 17.71%. The non-oil deficit dropped by 0.75% to $34.28B, and was up 9.83% from a year ago. There was a big jump in the volume of oil imports relative to July, offset by a drop in the price of oil.
There is a bit of a lag between the oil price futures and the import prices. Import prices tend to track Brent much more than WTI, and recently there has been a huge spread between the two (historically unusual). The average price for the oil we imported in August fell to $102.62 from was $104.27 per barrel. A year ago the price was $73.47. Every day in August, we imported 9.757 million barrels (Mbl), but from 9.067Mbl in July (which was unusually low), but down from 9.905Mbl a year ago.
On a year to date basis, we have made some progress on trying to kick the habit, sort of the equivalent of cutting back to two and a half packs of cigarettes a day from three packs a day. Yes, it's progress, but if we keep it up at this pace, its still going to kill us. So far this year we have averaged importing 9.201Mbl a day, down 2.4% from the 9.427 million average in 2010.
The Non-Oil (China, Mostly) Side
The best thing that could happen to help on the non-oil side of the trade deficit would be for the dollar to fall (particularly against the Chinese yuan, but against other currencies as well). China was once again the overwhelming problem on the non-oil side. Our trade deficit with China in goods rose to $29B in August from $27B in July.
A strong dollar not only makes imports cheaper, it makes our exports less attractive. However, a weak dollar will not do anything for the oil side of the deficit. There are few correlations that are stronger in the market over the last few years than oil prices rising when the dollar falls and vice versa. Not quite to the relationship between rising bond yields and falling bond prices, but pretty close.
Some of that is due to the flight to safety nature of the dollar. When the world gets scared, it buys the dollar, but also sells stocks. However, some of it is also because a weak dollar is good for earnings, and higher earnings mean higher stock prices over time.
It is not just a direct effect of say our being able to sell more goods in Japan because the dollar is weak relative to the yen, but U.S. companies are often in direct competition with Japanese or European companies in selling to third countries. For example, both General Electric (GE - Analyst Report) and Siemens (SI - Analyst Report) make MRI machines for hospitals. Assuming that they were of roughly equal quality, then when the euro rises sharply against the dollar, GE is going to be able to undercut Siemens for export orders to China or Brazil.
By country, we ran some small trade surpluses with Hong Kong, Singapore and Australia, but we continue to run large deficits with most of our other trading partners. The biggest deficit by far is with China, the source of many of the goods on the shelves of Wal-Mart, Target (TGT - Analyst Report) and other big retailers. It is 47.2% of our goods deficit and 63.6% of the overall trade deficit.
While China has agreed to let the yuan appreciate, so far it has done so at only a glacial pace. However, higher inflation in China than in the U.S. means that the real exchange rate is improving somewhat faster than that. Our deficit with the European Union rose this month to $9B, from $8.9B.
Where We Owe Big
We saw an increase in our trade deficit with OPEC ($13.3B versus $11.9B, obviously more related to the oil deficit than the non-oil side). Our trade deficit with Mexico rose to $5.5 billion from $49B, while the deficit with Canada (by far our largest trading partner) fell to $2.4B from $3.3B. Canada is our single largest foreign oil supplier.
The deficit with Japan rose to $6.7B from $5.2B. That increase might be indicating that the supply chain disruptions from the Tsunami are dissipating. However, it is disappointing that we never moved into a trade surplus with Japan, even with all those disruptions.
Check the Change, Not the Absolute Level
It is the change in the trade deficit that drives GDP growth, not the level. As long as the trade deficit shrinks, it will add to overall growth, even if the level is still awful. A rising trade deficit shrinks the economy on just about a dollar-for-dollar basis.
Getting the trade deficit under control has to be one of the top economic priorities. If we do it, economic growth will be much higher, and we might actually start to see some significant job creation. With the rise in employment will come higher tax revenues which will help bring the budget deficit under control.
To do that we need to do two things: first, get our oil addiction under control. The second is that "King Dollar" is a tyrant and needs to meet the same fate as Charles I and Louis XVI: Off with his head!
How the Fed Has Participated
The Fed seems to understand this, and a weaker dollar is one of the more important mechanisms through which quantitative easing will tend to stimulate the real economy (and is the key reason why we are getting so much criticism about it from the rest of the world, as a decrease in our trade deficit would mean a corresponding decrease in their trade surpluses).
Given very low core inflation and staggering unemployment I wish that the Fed would embark on QE3, although at this point that might be pushing on a string. Fiscal stimulus would be more helpful, but policy is going strongly in the other direction towards austerity.
The U.S. can simply no longer afford to be the importer of last resort for the rest of the world. As worldwide, trade deficits and surpluses have to sum to zero (barring the opening of major trade routes to Alpha Centauri), a reduction in the U.S. trade deficit has to mean that the trade surpluses of other countries has to fall (or other deficit countries have to run even bigger deficits).
Right now every country in the world is trying to maximize exports and minimize imports. We have to fight that battle as well, but it is a fight where we have been getting our butts kicked for decades now. Continuing to lose the fight could result in near fatal damage to our economy and way of life. As I said before, the trade deficit is a far bigger economic problem than the budget deficit—particularly over the short and medium term.
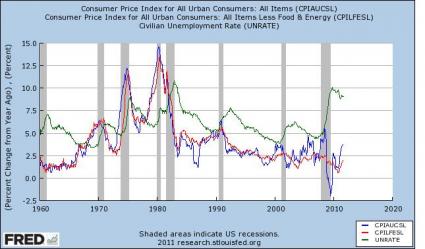
Core Inflation Far from Our Worst Problem
The downside of a weaker dollar is that it will tend to push up inflation. However, at this point, inflation is not a major problem, particularly core inflation, the non-food and energy part of inflation.
The final graph shows that core inflation (CPI), which is what the Federal Reserve tends to focus on, is at historic lows. Even including food and energy prices (red line), year-over-year inflation is still below where it has been for the vast majority of my life.
Let's start worrying about our real problems—we have more than enough of those—rather than imaginary ones. The trade deficit is high on the list of our real problems. Solving (or even making substantial progress) it would do wonders in helping to resolve the most important problem in the economy right now: the 9.1% unemployment rate.
Seriously folks, look at the graph below, and tell me how anyone could come to the conclusion that right now the Fed should be more concerned about the inflation side of their mandate than they are about the full employment side?