

However, TD Securities Equity Research points out this interesting fact: Over a period of 18 months prior to hitting $1,900, gold rose 79% but TD's basket of gold equities only increased 57%. The firm says this performance gap "ranks as the worst relative performance of gold equities to gold since 2001." During the July through September period of 2008, TD Securities' universe of gold equities declined 46%, while gold bullion only lost 24%. In October through November of 2008, the same gold equities lost 37%; while gold decreased 22%.
What's behind today's record disparity?
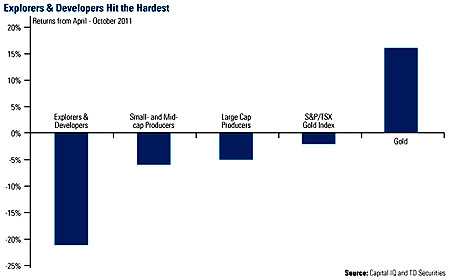
Part of it may be due to the underperformance of the explorers and developers, which, TD says, "have been hit the hardest." The chart below shows gold miners by capitalization and their returns since April 2011. Explorers and developers have declined the most, losing 21%, small- and mid-cap producers have declined 6% and large producers lost 5%.
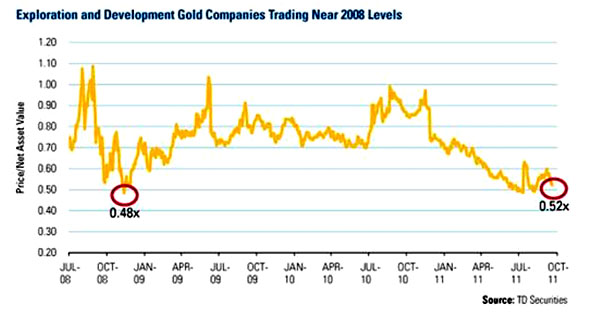
Because of the dramatic price decline in these early-stage companies, investors have the opportunity to purchase explorers & developers (E&D), often referred to as juniors, at about half of the company's net asset value (NAV). In simplest terms, the NAV means assets minus liabilities. In fact, you can see from the chart that the current price-to-NAV level for E&D equities is sitting near record low levels. . .levels not seen since the financial crisis of 2008.
TD found that in seven of the past 10 rallies, gold equities beat goldaveraging a beta of 1.4 times. Looking over the next year or so, we believe the smaller gold miners are especially poised to outperform this time. As TD says, "on a rebound, we expect the best performing equities to be among the ranks of the explorers and developers."
To gold equity buyers like U.S. Global, this represents a tremendous buying opportunity.
The NYSE Arca Gold Miners Index is a modified market capitalization weighted index comprised of publicly traded companies involved primarily in the mining for gold and silver. The index benchmark value was 500.0 at the close of trading on December 20, 2002. Beta is a measure of the volatility, or systematic risk, of a security or a portfolio in comparison to the market as a whole. The S&P/TSX Global Gold Index is an international benchmark tracking the world's leading gold companies with the intent to provide an investable representative index of publicly-traded international gold companies.
All opinions expressed and data provided are subject to change without notice. Some of these opinions may not be appropriate to every investor. Past performance does not guarantee future results.


