

Looking back on the daily charts of the dollar, SP500, gold, and also the overseas markets it looks as though we are nearing a market bottom. I say NEARING because I think investments need more time for the current selling pressure and bearish sentiment to run its course, which could take another few weeks and possibly a few months before truly bottoming.
Let's take a quick look at some charts. . .
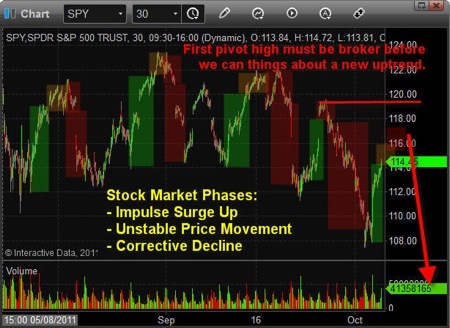
SPY 30 Minute Chart Looking Back 2 Months
As you can see below price action has been wild. But for subscribers to my newsletter it has been a fun and exciting time having pocketed over 40% return from August 1st—up until today.
The point of this chart is to show you the basic market phases (Impulse, Uncertainty, and Corrective). Understanding how to identify each phase using momentum, price action, volume analysis and market sentiment is crucial for success in today's volatile market. Once mastered you can trade virtually any investment with a high level of confidence, though I recommend mastering 3-4 investments at most and just trading those full time with pinpoint accuracy. Through my newsletter members learn exactly how to read the market and manage positions from my daily video market analysis, intraday updates, trade alerts and trading tips.
As you can see below I am anticipating weakness in the market over the next few days. Once those levels are reached or if the charts start hinting that a reversal back down is imminent I will be ready to take action using an inverse leveraged ETF.
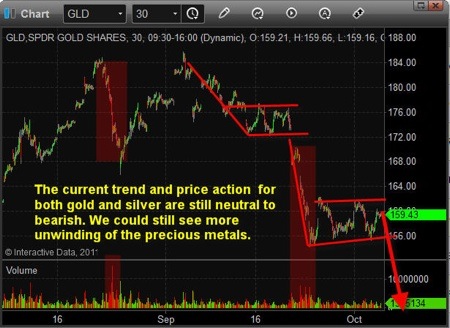
Gold 30 Minute Chart Looking Back 2 Months
This chart will piss some people off for sure. . .but the chart to me is still pointing to lower prices at this time. Until we get a breakout above the upper resistance level I am not bullish on gold. Keep in mind that during strong selloffs in the stock market almost all investments drop together (gold, silver, oil, stocks).
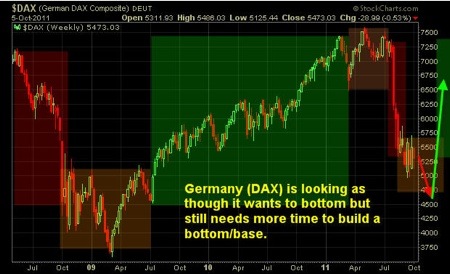
German DAX Daily Chart Looking Back 3 Years
This chart shows the long-term chart of the DAX, which I think is giving us some insight to a global market bottom in the coming months. You will notice I painted the phases over the chart and where I feel the market is trading and where it is headed looking forward.
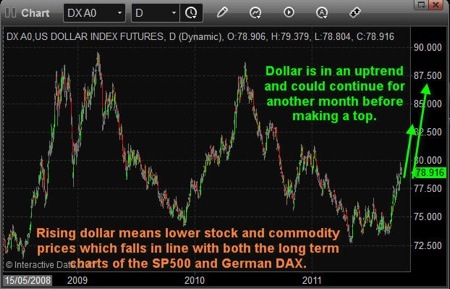
Dollar Index Daily Chart Looking Back 3 Years
The dollar also shows us three years for price action. If this strong rally continues in the dollar we will see lower stock and commodity prices for a few more months.
In short, I feel we have some very exciting times ahead along with huge potential trades starting to unfold. While I don't want the market to collapse, I will admit I prefer trading the short side of the market because fear is easier to trade than greed, not to mention prices drop much quicker than they rise. . .I'm sure you like making money fast also. . .
I can email you my biweekly reports and videos by joining my free newsletter here: www.GoldAndOilGuy.com
Chris Vermeulen


