

The fall was triggered by three key factors that caused the powerful move down. The first factor is based on pure technical analysis (price and volume patterns). Because the metals had such a strong run up this summer and prices had moved to far too fast, it is only natural so see price correct back to a normal price level. In general, any investment that surges in one direction in a short period of time almost always falls back down shortly after. As I stated in my weekly report on August 31st, "gold is forming a topping pattern and all investors should take profits or tighten protective stops (exit orders)." Three days later gold popped to the new high completing the pattern and was quickly sold off which continues to unfolding as we speak from $1920 down to $1532 in only a couple weeks.
The second factor that I think had the most power behind the drop were the margin requirements changes. This new rule literally overnight caused traders and investors holding to much of the metals in their account to liquidate (sell) their positions without having any say in the matter. That is when the most damage was done to the price of gold and silver.
The key factor was that the U.S. dollar rocketed higher and added a lot of pressure to the metals. I also covered this in my Aug 31st report in detail. Overall, in the past few years we have seen both gold and silver move in opposite directions of the dollar. I don't expect that to change much going forward. Back in August, the U.S. dollar was coiling (building power) and it was only a matter of time before it would explode to the up side and rallied. This high probability move in the dollar was what triggered me to exit our long gold positions shortly after. I expected the dollar rally to last a month or more and that means we would see a lot of pressure on equities and metals going forward.
Now keep in mind, if Greece or other countries continue to get worse then we could see the dollar and gold move higher together as they are seen as the safe haven at this time. But with the nature of the two, I am anticipating a rising dollar and sideways trading range for gold.
Ok, so back to precious metals investor sentiment. . .
Last Friday and all of this week I have been getting emails from traders and friends saying they are going to sell their gold and silver because they are concerned metals will continue to fall and because many of them are now losing money after chasing prices higher through the summer. The good news is that one of my best indicators for helping to time market tops and bottoms is to just read my emails and answer the phone. During market tops, generally the final month when prices are soaring to new highs every day/week is when everyone contacts me and says they just bought gold or are about to buy more gold cause it's such a great investment. Once I start getting 2-5 of these messages a day alarms start going off in my head. This works the same with market bottoms. So with everyone now in a panic and selling their positions I feel we are darn close to one if we did not see it already. . .
Let's take a look at the charts. . .
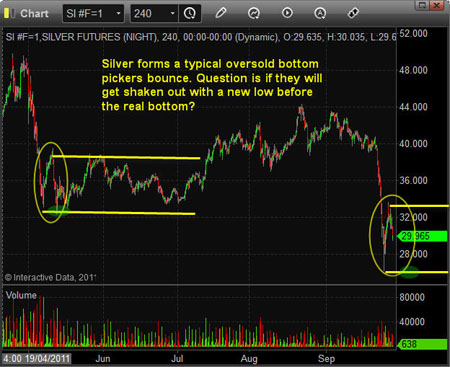
Silver Spot/Futures Price Chart
As you can see on the hard right edge silver is forming a very similar pattern, which happened this past spring. I would like to note that this type of pattern is typical with extreme market sell offs as to how they generally bottom. I am anticipating silver trades in this range for a couple months and that we could see lower prices in the near term. But my upside target for silver in the coming few months is the $35-$36 level.
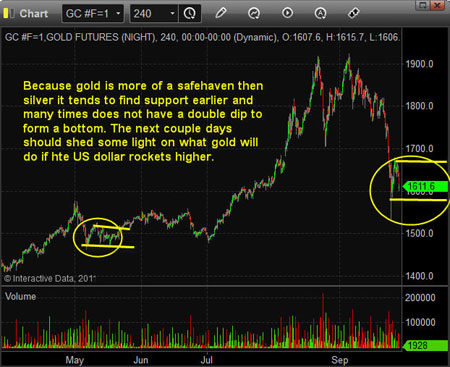
Gold Spot/Futures Price Chart
Gold is doing pretty much the same as silver but I have noticed that when gold falls hard the second dip generally does not make a new low as often. If we do get a new low, all the better for buying on the dip but overall I feel gold should trade sideways for a couple months. My upside target for gold is the $1750-$1775 area.
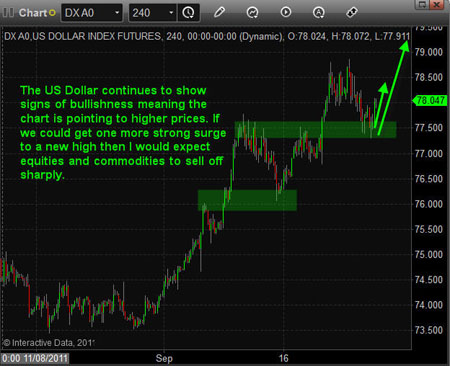
U.S. Dollar Index Price Chart
The dollar index is looking ripe for another bounce and possibly another rally to new highs in the coming week. If this happens then we should see the SP500 short position (SDS) which we took Tuesday afternoon (Sept 27th) to continue rocketing another 5-8% in our favor again.
Mid-Week Trading Conclusion:
In short, I feel the U.S. dollar is going to continue higher and that will put the most pressure on stocks, oil and silver. Depending how things evolve overseas gold could hold up and possibly rise with the dollar.
So far, subscribers have pocketed over 40% gains this month using ETFs on the SP500, dollar and oil and are holding another winning trade in the SDS ETF taking partial profits today. If you would like learn more about ETF trading and receive my daily pre-market videos, intraday updates and detailed trade alerts that even the most novice trader can follow then join my free trading education newsletter and my premium trading service here: http://www.thegoldandoilguy.com/trade-money-emotions.php.


