

The situation in Europe continues to worsen and central banks and wealthy individuals are trying to find safe havens to protect their wealth. Most gold bugs believed that gold and silver would be the answer, but in this environment that hypothesis did not play out. In addition, the Federal Reserve came out with operation twist, which market participants despised. Since the third round of Quantitative Easing was not announced, risk assets such as the S&P 500, gold and silver sold off sharply.
Many gold investors believed that gold is a "safety" trade. I would agree with them if the objective is to remain "safe" from ever rising inflation. In a "run for the exits" sell off caused by deflationary pressure and debt destruction, gold will generally show relative strength versus equities. However, I would remind readers that during the deflationary period back in 2008, gold held up far better than the S&P 500, but prices were volatile.
The gold futures chart from 2008 is shown below:
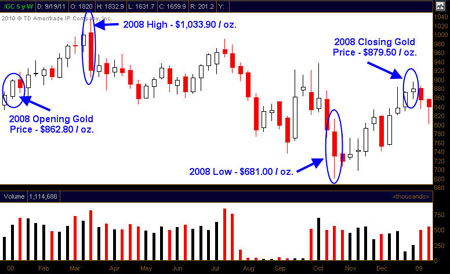
As can be seen from the chart above, gold futures were volatile throughout 2008 with the March high point representing a 19.83% gain for the year. The low point for gold futures in 2008 was in October and represented a loss of 21.07%. The total return for gold futures in 2008 was 1.94%. Clearly gold futures showed volatility throughout 2008, but gold clearly outperformed the S&P 500 during the same period of time.
The S&P 500 was lower by 37% in 2008, thus gold was clearly the safer asset during 2008 in terms of return. However, one asset class was safer still and had considerably less volatility . . . the U.S. dollar. In 2008, the U.S. dollar index futures closed the year with gains around 8.44% with far less volatility than gold or the S&P 500. I am pointing this out to readers because a similar situation is unfolding presently.
Moving forward to the present, the U.S. dollar Index futures have put on an impressive rally that started back on August 30, 2011. Since August 30th, the dollar Index futures are trading higher by around 7%. As it turns out, on August 31st I entered a long call ratio spread using the UUP ETF with members of my service and we were able to lock in a gain of around 30% recently.
The daily chart of the U.S. dollar Index futures is shown below:
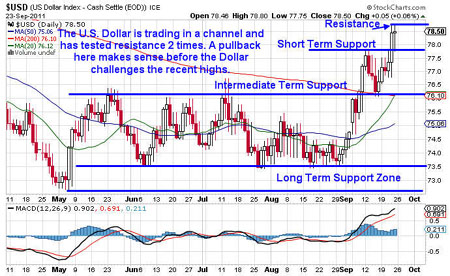
All of the calls for hyperinflation in 2011 and a massive crisis in the U.S. dollar are not coming to fruition. In fact, the opposite is occurring as deflationary pressures are helping force the U.S. dollar higher. I would point out that the majority of economists and analysts were all predicting hyperinflation for several years and so far they have been wrong. Gold, nor any other asset, can rally forever but long-term investors must understand that even during a raging bull market, corrections and pullbacks are commonplace and healthy.
I want to point out that I sent out multiple articles warning about the possibility that gold prices could sell off or correct dramatically. In every instance, my email inbox was littered with hate mail and vitriolic remarks from gold bugs. Back on August 29th, I wrote the following in my article, "What Could Lie Ahead for the S&P 500 and Gold":
"There is an ominous pattern starting to form on the gold daily chart which, if it is carved out and triggered, could produce the next leg of this sell off."
The daily chart of gold is shown below:
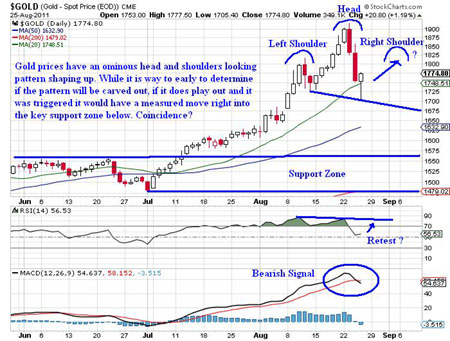
"While it is far too early to determine if a head and shoulders pattern will be carved out or if lower prices take place, I am of the opinion that this selloff will offer an attractive entry point for longer-term investors. At this point it is a bit too early to get involved, but if my analysis is accurate the next leg of the gold bull market will be potentially extreme."
As it turns out, the head and shoulders pattern did not play out as I had hypothesized but a double top did emerge which ultimately produced similar price action. The extreme nature of the recent sell off backs up my analysis in that gold prices had gone parabolic and we needed to see regression back to the mean in terms of price.
We are seeing that process unfold now, but as I stated in the article above the completion of this sell off is going to offer an attractive entry point for long-term gold investors. While I have routinely discussed pullbacks and corrections regarding gold, I continue to be a longer-term bull.
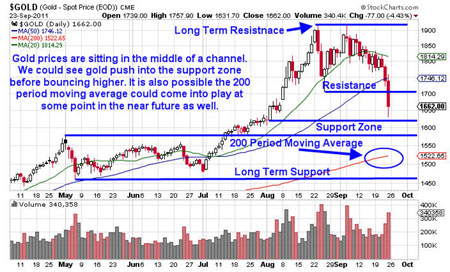
Gold has sold off sharply in the past week, but the following chart illustrates some key support levels for the yellow metal:
While gold and silver sold off sharply, the S&P 500 was also under extreme pressure. My most recent article written on September 21 prior to the Federal Reserve announcement illustrated two outcomes based on what rhetoric came from the meeting. Unfortunately, for equity investors my downside prognosis is holding sway. The follow is an excerpt from my article entitled "The S&P 500 & the dollar Ahead of the Fed Statement":
"The flip side of that argument would see the S&P 500 jamming into recent resistance around the 1,230 price level.If prices rolled over and momentum picked up, a test of the recent August lows would likely transpire and could produce a breakdown and a lower low.
When looking at recent price action, the S&P 500 Index has put in a series of higher lows, which is a bullish signal, however the S&P 500 has a long road ahead to break out above the 2011 highs. If the S&P 500 carves out a lower high on the S&P 500 Index at 1,230, 1,250, or even 1,280 and subsequently takes out the August lows then the secular bear will be back. The weekly chart of the S&P 500 Index ($SPX) shown below illustrates key support levels:
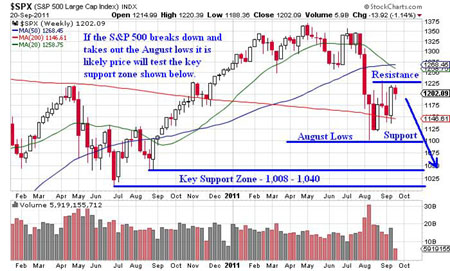
For now, I am just going to sit in cash and wait for Mr. Market to provide me with some better clues. The trading range is pretty wide going from around 1,100 to 1,280."
My downside scenario played out last week, but I will be watching closely to see if the S&P 500 can push below the August lows. If the August lows are taken out, we could see support come in around the 1,085 price level. If that level breaks down then the 1,008-1,040 price range will be in play.
The daily chart of the S&P 500 Index is shown below with the key support levels illustrated:
In closing, last week was wild in terms of price action and volatility was nearly palpable. I am anticipating some additional volatility this coming week. Gold prices could bounce as price is sitting right at the key 50 period moving average. If gold works through the 50 period moving average additional downside will be likely.
Similar to gold, if the S&P 500 is able to push through the August lows, additional sellers will step in as stops will be triggered on a breach of the S&P 1,100 price level. News flow and headline risk coming out of Europe will continue to impact price action. I would also point out to members that there is a standing chance that the U.S. government could shut down as budget issues continue to manifest within the confines of the U.S. Congress.
Risk remains extremely high.
Review my track record and join now at www.OptionsTradingSignals.com/specials/index.php and receive a 66% off coupon which expires tomorrow.
J.W. Jones
This material should not be considered investment advice. J.W. Jones is not a registered investment advisor. Under no circumstances should any content from this article or the OptionsTradingSignals.com website be used or interpreted as a recommendation to buy or sell any type of security or commodity contract. This material is not a solicitation for a trading approach to financial markets. Any investment decisions must in all cases be made by the reader or by his or her registered investment advisor. This information is for educational purposes only.


