

A while back, I wrote about this in my newsletter:
"Do not listen to those who call silver a bubble! It is very likely that, believing them, you will miss out on the greatest silver rally in recent times. Now, I cannot tell you for sure that silver or gold is going to rally from herenobody can. What I do tell you is that all the signs that I look at are indicating that silver and gold will rally significantly from around this area.
Silver compared to gold
Let's compare silver's attack of its 1980 all-time high to that of gold. I believe this to be a justified comparison due to the fact that silver and gold's prices have such a high correlation; but despite that they have a high correlation, they sometimes reach similar milestones at different times. Let me explain by way of the following chart:
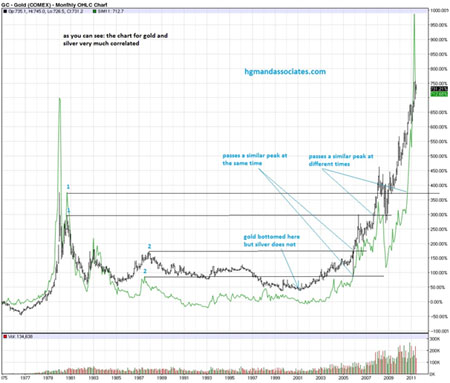
The green is silver and the black is gold. I have marked a similar peak for silver and gold as 1 and another as 2. Notice how at one time gold and silver pass their similar peaks at the same time, and at another time they pass it separately. But even on the occasion that they passed their peaks at different times, the manner in which the peaks were passed were still very similar.
I have also indicated where gold bottomed but silver did not. Silver instead bottomed at about 1993. Again, despite the fact that silver and gold bottomed at different times, their manner or pattern of bottoming was still very similar.
So, there is not just a similarity in how gold and silver trade at the same time period, but also how they trade at similar milestones, despite the fact that those milestones are sometimes reached at different times. This can cause silver or gold to be the leading indicator, depending on the particular milestone. In this case (milestone of reaching the 1980 peak), gold is undoubtedly the leading indicator, so it could help us to project what silver might do around this milestone.
I have previously made my view clear regarding where I think silver is in this bull market. I have noted that silver has formed a cupin a similar manner as gold didwhen it reached the $50 mark. I consider the pullback to the $32 area (about 1/3 retracement of depth of cup) as normal; therefore, I consider the probability of silver going lower than the $32 level as highly unlikely.
Let us see if gold's behavior, when reaching its (relative) 1980 high in 2007, can help us to predict what silver will do going forward.
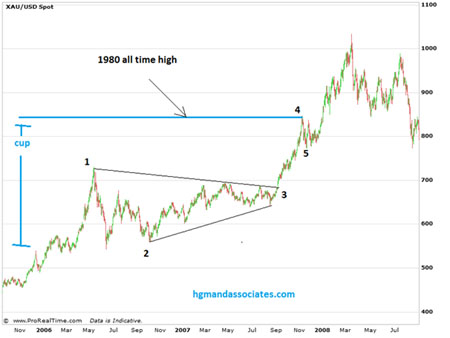
In the chart above, you can see that gold made a triangle-type pattern just before it reached the 1980 all-time high. When it came out of that triangle pattern, it rallied strongly to the 1980 high, which started the formation of a flag-type pattern. From the flag pattern, price shot upward to the $1000 level. It is also worthy to note that point 4 of that flag pattern represents about the halfway point from point 3 to the eventual top ($1000).
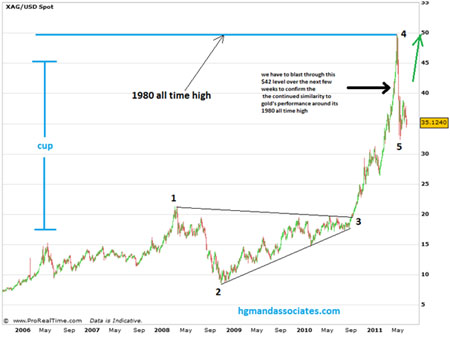
Above, you can see that silver also made a big triangle-type pattern before it reached the 1980 peak. When it came out of the triangle, it rallied very strongly to the 1980 peak. At the peak it fell down to the $32 area. Is it currently forming a flag or similar pattern, just like gold did? I certainly believe so. I believe if price goes through the $42 level, it will confirm that silver is going to go back to $50 and soon blast through it, just like gold did through its 1980 peak. A fall below point 5, and all bets are off. However, I believe this possibility to be unlikely.
If we assume that silver does go through the $50 level, what target can we expect? If we use gold's performance to establish a target for silver, it would appear that $80 would be a minimum. I think it will be much more."
Currently, silver appears to be at the end of a flag-type pattern, just like gold's at the end of 2007 (see above); so, it appears the correlation as explained above is still on track. Silver is about to take the lead in this precious metals bull market.
For some more analysis on gold and silver, you can visit my website: website. Please note that the domain: hgmandassociates.com is no longer active.


