

On Sunday I warned subscribers that any day now gold should start to correct and there is potential for it to drop all the way back down to the $1640$1670 area depending how much of the recent buying volume was investment versus speculative money which will quickly sell out if prices began to fall.
Take a look at the intraday charts below to get a visual of how money is moving around the market and how economic fear plays a roll on investment decisions:
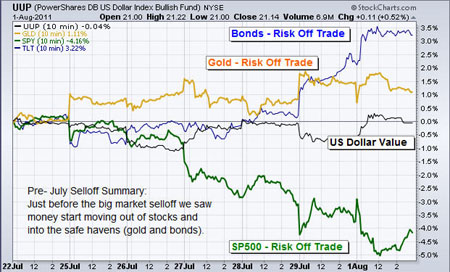
Seven-Day 10 Minute-Chart, Pre-Market Selloff This Past July
Here you can see investors became fearful of the stock market/economic environment. Money started to get pulled out of the high risk (Risk On Trade) equities market and put to work in the Low risk (Risk Off Trade) to earn small but steady income and to help fight inflation (Gold & Bonds).
After this shift the stock market sold off very strong for a couple weeks before finding a bottom.
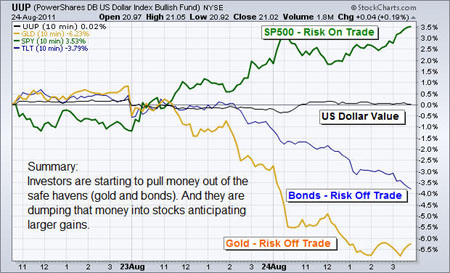
Three-Day 10-Minute Chart, Post-Market SelloffToday's Prices
If you compare these two charts you will notice they are both opposites to each other. . .
Meaning money is now getting pulled out of the risk off (gold & bonds) and put to work in the potentially high yielding stocks (risk on).This could be the start of a big upside move starting to unfold and I will be keeping my eye on some charts for possible entry points like SPY and TBT.
Mid-Week Trading Conclusion:
In short, the overall market seems to be entering another pivot point. It is likely that another big move is brewing. . .After this type of technical damage on the charts and heightened fear/emotions out there, it may cause prices to trade sideways in a large trading rage for a few weeks still so I'm not getting overly excited just yet.
Consider joining us at TheGoldAndOilGuy for ETF trade ideas on the SP500, Oil, Gold, and Silver with great accuracy. Check us out at www.TheGoldAndOilGuy.com
Chris Vermeulen


