

Armed with cash and my emotional capital intact, I am going to be able to take advantage of price action in coming days and weeks. I am expecting a bounce in the near term, but the downgrade of U.S. debt on Friday by the S&P rating agency could have a dramatic impact at the open on Monday morning. I intend to remain in cash until the news is digested by the marketplace.
My first public warnings about a potential top came back on July 8, when I posited an article which illustrated the bullish and bearish position of the market at that time ahead of the debt ceiling debate in Washington. The following excerpt and chart was taken directly from that article:
"In addition to the short term overbought nature of the S&P 500, the daily and weekly charts clearly illustrate a head and shoulders pattern. The head and shoulders pattern is a typical characteristic of a topping formation that is often found at several major historical tops. The daily chart below illustrates the head and shoulders pattern:
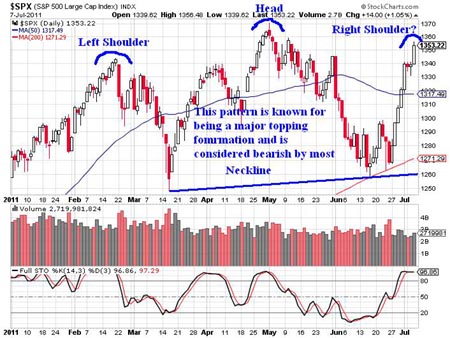
This particular head and shoulders pattern is not getting a lot of recognition in the media which lends it a bit more credence. If we start hearing about this pattern on CNBC or FOX Business I will expect the pattern to fail. Call me a contrarian, but in the past when major television personalities are constantly talking about chart patterns they almost always fail.
Besides just technical data points, continued worries stemming from the European sovereign debt crisis helps the bear's case further. In the event of a major default in the Eurozone, the implications to the financial sector of the U.S. economy will come into focus. It is widely expected that a banking crisis in Europe could spread to some degree to the large money center banks in the United States. Clearly this would have negative implications on price action in domestic equity markets.
In addition to the European debt crisis, the United States government has a looming credit crisis of its own. With politicians currently arguing over whether to raise the debt ceiling, bears point out that if the United States defaulted on its debt (unlikely) the implications would be severe. However, many traders and economists point out that the end of QE II may have dramatic implications on price action as well. The current uncertainty around the world lends itself in favor of the bears."
Clearly, the head-and-shoulders pattern has played out and barring a breakout over the 2011 highs on the S&P 500, an intermediate- to long-term top has been carved out. In fact, I believe we are likely entering the next phase of the ongoing bear market that started back in 2000.
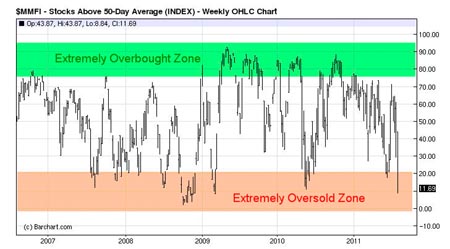
Panic-level selling pressure has been registered and the S&P 500 is in an extremely oversold condition as is evident by the charts below:
Stocks Above 50 Period Moving Average
Stocks Above 200 Period Moving Average
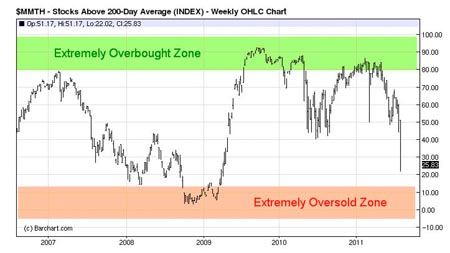
The charts above illustrate that we are extremely oversold in the intermediate term time frame and that we are nearing extreme oversold conditions in the longer term time frame as well. I am expecting a bottom to form in the next few weeks which should offer outstanding risk / reward long entries for short to intermediate term trades.
Another indicator that is showing some extreme fear in the marketplace is the Volatility Index (VIX). The VIX has traded in a choppy pattern for quite some time before finally pushing higher the past few weeks. The daily chart of the VIX below demonstrates the fear in the marketplace:
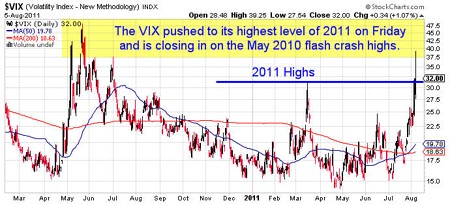
Almost every indicator that I monitor is screaming that the current market is extremely oversold and fear levels are running at or near 2011 highs. When the masses are fearful and the S&P 500 is this oversold, I want to be looking for opportunities to get long-risk assets.
While consistently picking bottoms is nearly impossible, there are a few key levels on the S&P 500 that I'm going to be monitoring. The weekly chart below illustrates the key support levels which could hold up prices and also future targets for the likely reflex rally:
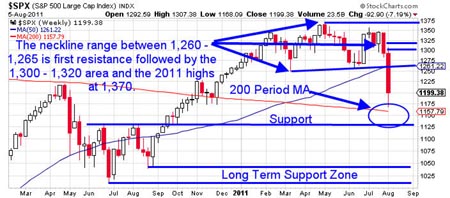
Once a bottom has been carved out, the use of Fibonacci Retracement and/or Extension analysis will help me determine more precise resistance levels. We could see further selling pressure this week before we see a pronounced bottom carved out. With volatility at these levels price action will be pretty wild. I intend to use smaller position sizes with wider stops to start layering into exposure as opportunities present themselves.
By sitting on the sidelines during this downside move, members of my service are ready to take advantage of lower prices to get long. Now the interesting part will be how Mr. Market handles the downgrade of U.S. debt on Monday . . .
If you'd like to try the OptionsTradingSignals.com subscription, take advantage of a one-time coupon code today! You get 3 months membership for the price of only 1 month!
Join Us Today: http://www.optionstradingsignals.com/specials/index.php
This material should not be considered investment advice. J.W. Jones is not a registered investment advisor. Under no circumstances should any content from this article or the OptionsTradingSignals.com website be used or interpreted as a recommendation to buy or sell any type of security or commodity contract. This material is not a solicitation for a trading approach to financial markets. Any investment decisions must in all cases be made by the reader or by his or her registered investment advisor. This information is for educational purposes only.


