

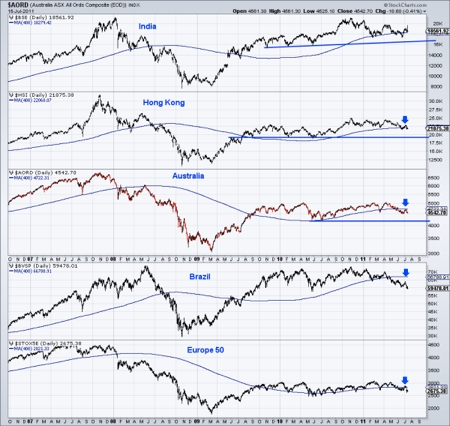
In the following chart we show important global markets. From top to bottom: India, Hong Kong, Australia, Brazil and the Europe 50 Index. The last three have broken below a no longer rising 400-day moving average while Hong Kong is quite close to reaching the same fate. More importantly, most of these markets do not have strong technical support nearby to prevent a selloff that builds downside momentum.
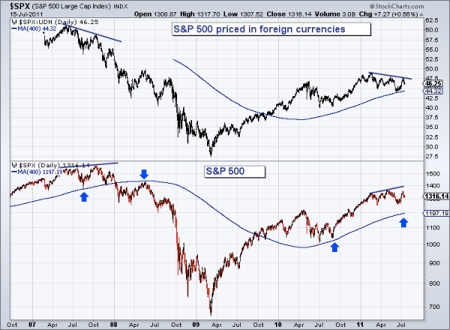
The S&P 500 looks okay, but why? In the chart below we compare the S&P 500 against the S&P 500 priced in a basket of foreign currencies excluding the greenback. The market priced in foreign currencies reached only a marginal new high in 2011 and is currently trading below its 2010 high. Meanwhile, in USD terms, the market is trading comfortably above its 2010 high.
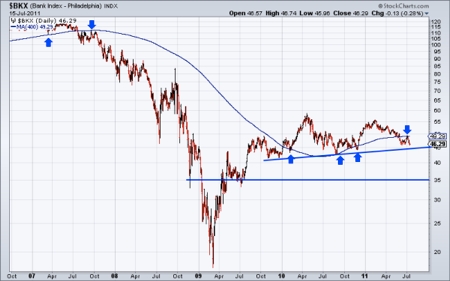
The S&P 500 is holding up okay in relative terms, but that's only because global markets have had a head start. The S&P 500 may only be six months behind. One reason is the precarious circumstances of the banks. Below, we graph the Bank Index, which looks like crap. Sorry, it is an apt description. The banks have broken below a 400-day moving average, which has stopped rising. The banks have some support from 42-45 and if that is broken, look out below.
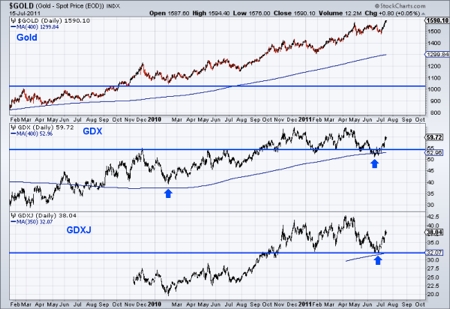
Next we look at gold and the gold shares. From top to bottom we graph gold, GDX (large caps) and GDXJ (large juniors). The horizontal line on each chart marks the previous (20072008) all-time high resistance. GDXJ's is based on a re-balancing of the index pre-2009. Anyway, we see that gold has broken to another all-time high while the shares rebounded strongly from important support. Moreover, the precious metals complex is trading beyond the former highs, while important global markets failed to do so. GDX and GDXJ can explode when they surpass the 20102011 highs.
Before we conclude, we need to make some distinctions between today and 2008. Today's credit stress is primarily with governments. The stress and liquidation from the private sector dominated the landscape in 2007 and 2008. Governments have absorbed many of those losses and now it is the credit quality and creditworthiness of governments that is come into question. Remember, when you or I have credit problems, it is deflationary as we have to sell things to raise cash. For governments, it is inflationary, as debt crisis always become currency crisis.
Secondly, if you've followed our recent editorials you'll know that sentiment indicators for precious metals are very encouraging. In recent weeks, speculative long positions in both metals were near multi-year lows. Public opinion in both gold and silver are nowhere near the highs. Also, assets in the Rydex Precious Metals fund were recently at a two-year low. All of this, with the sector trading near record high. Back in 2008, the sector was trading near record-year highs and the speculation and optimism reflected that.
Finally, in analyzing bull markets lasting 1520 years, we've noted that an acceleration in trend usually begins in the 11th or 12th year and is obvious by the end of the 12th year. Gold is in its 12th year, while the 12th year for gold stocks would begin in Q4 of this year. Note that gold has broken to a new high ahead of the typical breakout in September. That is another hint at what is to come. The next 1824 months figure to be quite exciting and extremely profitable for those invested in this bull market. If you'd like to learn more about how to profit, manage risk and have a professional guide you, then you can learn more about our service here.
Good Luck!
Jordan Roy-Byrne, The Daily Gold
[email protected]


