

The general rule is if the dollar falls in value then we tend to see both stocks and commodities rise. The inverse relationship at times can be tick for tick meaning if the dollar ticks down one increment then we see the broad market or specific commodities move in the opposite direction at the same time.
Since 2009, the relationship between the dollar and investments has been so close that if you were to just focus on what the dollar was doing then you could almost trade equities and commodities without reading their charts. The Dollar Index chart is one of those trading tools everyone should be analyzing. At $80 a month for getting the Dollar Index data feed, it's not a cheap trading tool.
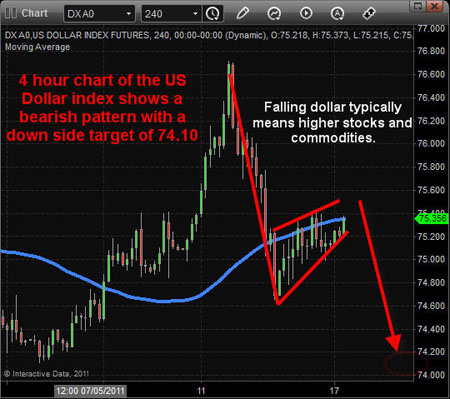
Dollar Index 4-Hour Candle Stick Chart
This chart clearly shows this month's price action for the dollar, which is pointing to lower prices if things play out according to the charts. This short-term chart shows that in the next day or so we should see the U.S. dollar start to sell back down.
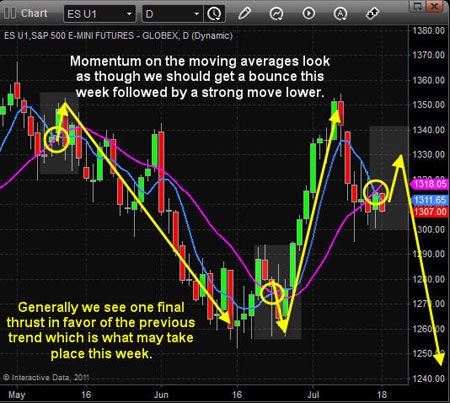
SP500 Daily Chart (Stock Market)
The SP500 index is a great barometer of what the overall stock market is doing. The chart below shows the 5- and 14-day simple moving averages and their recent crossovers.
Last Friday, we had a bearish crossover and, if the market does not rally early in the week, I am anticipating further weakness in stocks. While I am still bullish on stocks as of this moment, the coming week will quickly tell us what stocks are going to do. If we get a bounce that turns into a strong follow through rally, we should see a sizable rally around the corner and a falling dollar.
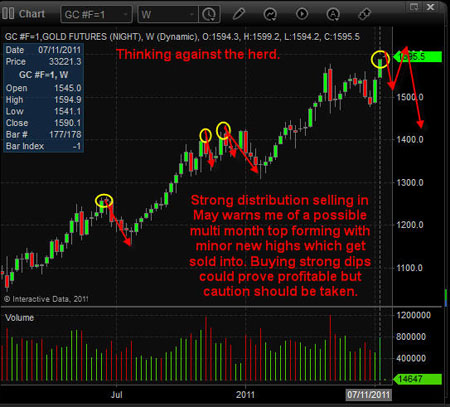
Gold Weekly Chart
Back in May when gold was hit with strong distribution selling, I posted my thoughts on how gold could be forming a 6- to 12-month topping pattern and how price could get choppy. Well, we are now entering that period, which could prove to be interesting.
Keep in mind this is a weekly chart—and from the looks of things this top could play out for another five-six months from here. Silver is in much of the same predicament but trading way below its May high. I'm thinking more of a double top in silver over the next few months.
Weekend-Trend Trading Conclusion
In short, I am bearish on the dollar for a week or so which should help boost stocks and commodities. After that, we could see all investments make some big trend changes if buyers don't step up to the plate to buy. If we any major headline news about the sky is falling then it could trigger a sharp correction. Unfortunately, at this time head line news is running wild spooking investors from buying much of anything other than gold. Any resolution to foreign economic issues will put pressure on both gold and silver and likely help boost stocks.
This past month, I have been very cautious because the market is wound up and ready to explode in either direction. During times like this, I prefer to stay mostly in cash until I get low-risk setups and a clear trend.
That's all for now, but if you would like to get my pre-market video analysis of the dollar index, each morning and intraday updates along with my trade alerts be sure to join my premium service at $59 a month which is less than the cost for the dollar index charting data feed! Join now.
Chris Vermeulen


