

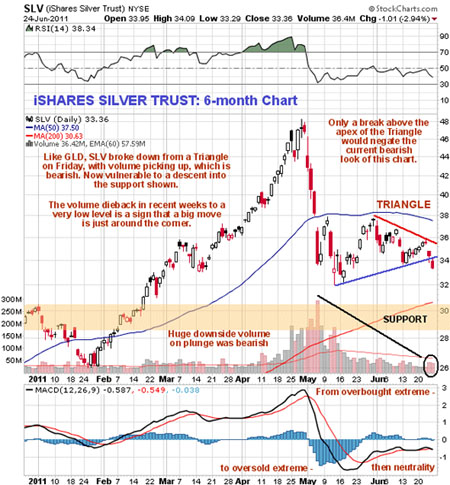
It doesn't look good, people—both gold and silver broke down from Triangles on Friday, after looking like they were about to break out upside on Wednesday. We can see this breakdown on the 6-month chart for our proxy iShares, which occurred on a noticeable pickup on volume, which is also bearish. This was a rather complicated one to call, because of conflicting factors, and because we couldn't call it, we did a straddle a few days back that promises to pay off handsomely.
Here's why it was complicated—the high volume plunge early in May was bearish, with various factors indicating that silver had burned out for the foreseeable future. Chief among these being the frenzy of public participation that had been whipped up by cheerleaders, some of whom were talking about silver at $300 an ounce, which resulted in volume in silver reaching climactic levels as it rose to become extraordinarily overbought.
On the other hand, silver had fallen back a lot to a point not very far above its rising 200-day moving average, and with none of the problems in the world financial system having been fixed—on the contrary, they have gotten worse&151it is easy to see how silver could stage a significant rally from here. However, the market appears to have declared itself with the breakdown on Friday, and with the savage reversal back to the downside in the broad stock market late in the week, so that it is perilously close to crashing key support and plunging, so the stage may well be set for another sharp selloff in silver, the initial downside target for which would be the zone of support in the approx. $28.50$30.30 area shown on the chart.
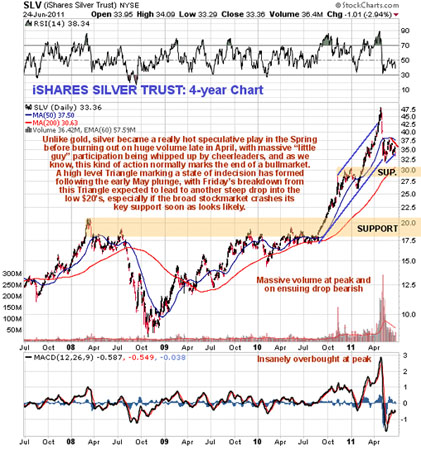
While the long-term chart for gold shows a steady uptrend that looks set to continue—free from the kind of speculative excess that would indicate a possible top—the same cannot be said for the 4-year chart for silver, on which the late-April peak looks like even more of an anomaly. This chart suggests that at best silver needs more of a rest before it can gain serious traction again and it's likely to dip to the $28$30 area first—lower still if the stock market tanks as look likely soon—more on this subject in the Gold Market Update.
Silver Market Update


