Goldman Sachs Turns Bullish on Commodities
Founded in 1869, Goldman Sachs (GS) is one the world's leading investment banking and securities firms. Goldman is famous for the work ethic it demands, its ability to attract the brightest minds and that indefinable X-factor that comes from being acknowledged as the best game in town. The predictions and opinions of its employees are widely followed and have been known to influence the market. . .However, over the past few years Goldman's reputation has been damaged. Besides the very public civil-fraud lawsuit filed against GS by the SEC in 2010, much of the American public accuses GS in playing a major role in causing the 2008 financial crisis, even during which GS paid its top managers multimillion-dollar bonuses. . .on May 24, 2011 GS reversed its tune on commodities turning bullish once again and suggested buying oil, copper, and zinc. The risk/reward once again favors being long commodities, Jeffrey Currie, head of commodities research at Goldman Sachs in London, wrote in an e-mailed report. Economic growth will likely be sufficient to tighten key supply-constrained markets in the second half, leading to higher prices. Yesterday, Brent crude oil advanced as much as 1.5%, US crude oil closed up 1.64%, and copper was up 0.6%.
Our view regarding the outlook for commodities and stocks concurs more with that of Richard Russell than that of Goldman Sachs. While we are looking for a short-term rally, as is Goldman, after that our charts suggest either a period of summer doldrums or more likely a correction.
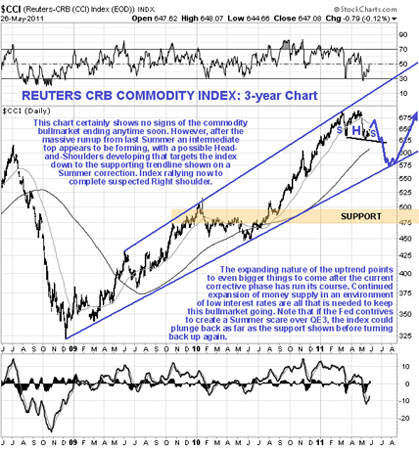
We will start by looking at the 3-year chart for the Reuters CRB Commodity Index. On this chart the key point to observe is that there is no sign of an end to the long-term commodity bull market, despite the recent toppy action in this index. The expanding nature of the trend channel on this log chart suggest that there are even bigger things to come for commodities than we have see thus far, hardly surprising considering the "print or die" dilemma facing governments and Central Banks around the world. That said, however, the sector has clearly gotten tired after its big run-up from last summer. After hitting a trendline target the index has run off sideways into what looks like a developing intermediate Head-and-Shoulders top, and if this is what it is a breakdown from the neckline of this pattern will project a correction back to the lower trendline of the major uptrend channel. Here we should note that if the Fed contrives to create a scare over QE3 not being forthcoming, in order to sluice funds into the dollar and Treasuries and drum up support for a later QE3 rescue, the index could break down from the channel and plunge 2008 style back to the important support level shown. This ruse by the Fed was discussed as a possibility on the site some weeks back, and Richard Russell also sees it as possibility for the same reasons.
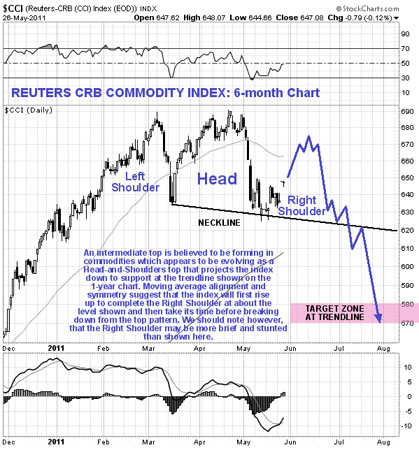
The 6-month chart for the Reuters CRB Commodity Index shows a scenario for how the Head-and-Shoulders top may complete and lead to a drop back to the channel support line shown on the 3-year chart above. There are two very important points for traders to note here. The first is that if this pattern completes in a symmetrical manner with a Right Shoulder forming that is similar in duration and magnitude to the Left Shoulder, then the rally now in progress should continue for a while, perhaps for two or three weeks before the index rolls over and drops. The second point is a corollary of the first, which is that moving average alignment strongly suggests that it is too early for a significant drop to occur. The danger will increase dramatically once the 200-day moving average has caught up with the index and the gap between the 50-day and 200-day has closed up significantly, and this is going to take time, probably a month or so, which fits with our projection for a leisurely Right Shoulder to form in coming weeks. Here we should note that another scenario exists which is the one where the Fed comes clean and admits it's going to do QE3 anyway and the pattern morphs into a rectangular consolidation, which is followed by another major upleg probably in the late summer going into fall. If things work out as planned we will be looking to short the right shoulder peak with a close overhead stop.
As you're probably well aware, everyone has gotten complacent over the broad stock market, with premature top callers continually getting burned as it has somehow stayed levitated, but as you'll now see, the situation is getting more dangerous with passing time. This is because the market is rounding over beneath the large parabolic "distribution dome" shown on our 1-year chart for the S&P500 Index. Few traders understand these dome patterns or what they portend. The rounding nature of the pattern is evidence that profit takers are increasingly overwhelming fresh buyers whose efforts to drive the market higher are blunted to the point that they have no effect at all. Once the dome starts to roll over, as is happening now, the bears have gotten hold of the ball, and it only takes the re-emergence of fear in the market to precipitate a potentially severe decline. Add into the mix that the market has just broken down from a 3-arc Fan pattern as pointed out by Richard Russell and shown on our chart, which usually precipitates a drop, and you have the recipe for a potentially heavy selloff. Here we should note that domes don't always lead to bear markets, as they can simply be a form of rounding correction - sometimes the market breaks suddenly above the dome boundary and a new major upleg ensues, but here the situation is complicated by the Fan breakdown—so it will take not just a break above the dome boundary, but a break back above the 3rd fan line to turn the market bullish again.
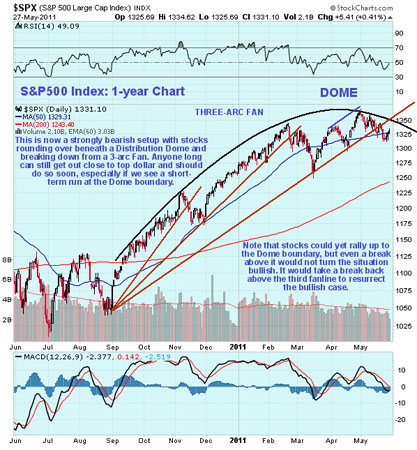
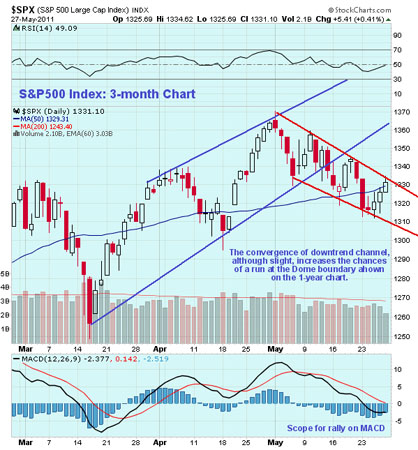
On the 3-month chart for the S&P500 Index, we can see how the slight but definite convergence of the shorter-term downtrend channel in force from early May—which is bullish—is increasing the chance of an upside breakout from this channel, especially as the MACD is showing a rather oversold condition. That would set up a run at the dome boundary, which is a point at which to short the market with a close overhead stop. Such a short-term rally fits with commodities' short-term term rally scenario.
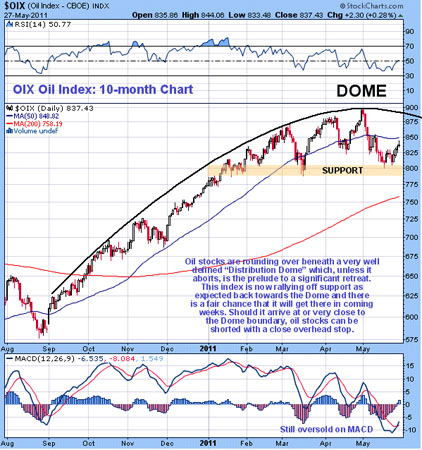
A very similar dome has earlier been indentified on the oil stock indices, which is hardly surprising as oil stocks have been slavishly following the broad market.
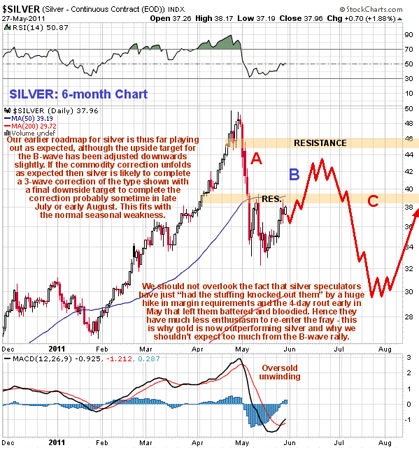
Silver has been following our script for weeks now and still looks set to complete a 3-wave A-B-C correction, with a likely scenario being shown on its 6-month chart. Silver is now underperforming gold, which is to be expected, given how silver speculators have just been steamrollered by the plunge that followed huge margin hikes. Like the survivors of the Battle of Waterloo they are showing rather less enthusiasm to get back into the fray, which is why we are not expecting silver to make new highs on the current B-wave rally and have adjusted our target downwards slightly for this move to the $43 area. This is different from gold, which could easily make new highs on its B-wave rally before dropping back.