

 The S&P credit agency sent shockwaves through the global financial system on Monday when it issued a warning on U.S. debt and changed its outlook on the U.S. sovereign credit rating from "stable" to "negative." This sent markets lower and the prices of commodities such as oil rocketing back above $110 per barrel and both gold and silver to new highs.
It should be clear the S&P announcement was just a warning, not a lowering of the U.S. debt rating, which was affirmed at AAA (the highest level possible). The fears quickly subsided and U.S. markets hit fresh three-year highs. Essentially there's only a one-third chance of a downgrade and anyone who's ever listened to the weather man knows that a 33% chance of rain means you probably don't need your umbrella.
However, the warning validates what we already know: The U.S. needs a plan to address its debt and budget issues and fast. Due to the fact that future fiscal austerity measures will likely act as a drag on the economy, we also think this opens the door for a third round of quantitative easing (QE3) heading into next year so we'll have to keep an eye on Bernanke and the Federal Reserve's next move.
These factors will likely produce downward pressure on the U.S. dollar and upward pressure on commodity prices. This is why we emphatically believe the bull cycle for gold still has a long way to run. (Read: The Bedrock of the Gold Bull Rally).
Last week, one of my fellow presenters at the Denver Gold Group's European Gold Forum was Dr. Martin Murenbeeld from Dundee Wealth who put the notion of a "gold bubble" in context with the following chart.
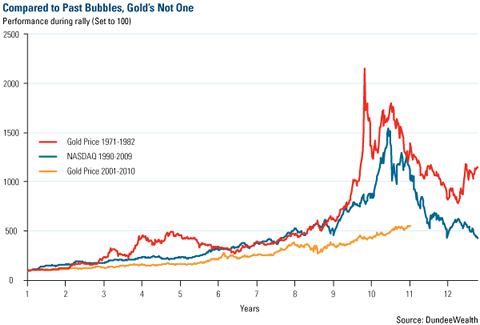
If you compare the current bull cycle for gold against gold's run from the 1970s and 1980s, you can see that today's run has been slow and steady. It's also missing the sharp spikes typical of a bubble.
Also, a key difference in this gradual move higher is the growing affluence of the developing world. There people have traditionally turned to gold as a store of wealth and we are seeing that in unprecedented numbers in countries such as China and India.
One of the things we recently pointed out was the effect money supply growth can have on gold. Dr. Murenbeeld also presented this fascinating chart showing how much gold would need to increase in order to cover the amount of money that has been printed since gold was revalued at $35 in 1934.
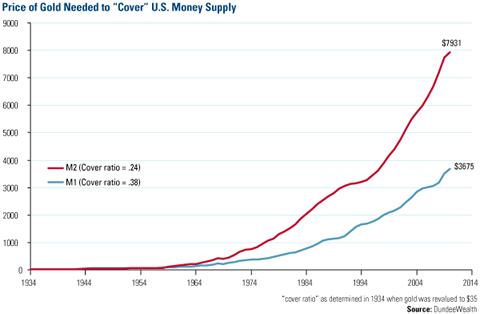
Using that as the cover ratio, gold would need to climb all the way to $3,675 an ounce to cover all paper currency and coins. If you use a broaderand more commonmeasure of money (M2), gold would need to rise all the way to $7,931 in order to cover the outstanding amount of U.S. money supply.
With gold pushing through the $1,500 level and silver above $46, many investors are questioning whether we'll see a pullback. Going back over the past ten years of data, you can see that gold's current move over the past 60 trading days is within its normal band of volatility, up about 7% over that time period.
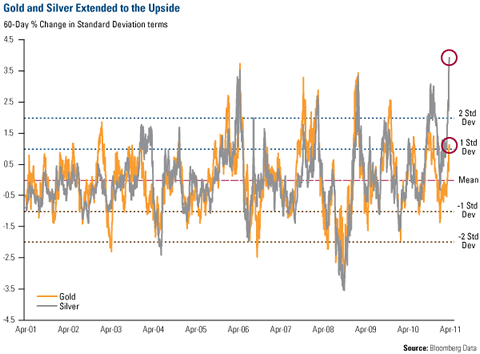
Silver, however, has traveled into extreme territory. Over the past 60 trading days, silver prices have jumped over 58% and now register nearly a 4 standard deviation move on our rolling oscillators (see chart). Based on mean reversion principles, odds favor a correction in silver prices over the next few months.
We should be clear: If a correction occurs, this would not mean the rally is over. It would just be a healthy bull market correction and reflect the normal volatility inherent with these types of investments. Investors must anticipate this volatility before participating in these markets.
This volatility also brings along opportunity. We believe we're only halfway through a 20-year bull cycle for commodities and investors can use these pullbacks as an opportunity to "back up the truck" and load up for the long-haul.
Director of Research John Derrick contributed to this commentary. For more updates on global investing from Frank and the rest of the U.S. Global Investors team, follow us on Twitter at www.twitter.com/USFunds or like us on Facebook at www.facebook.com/USFunds. You can also watch exclusive videos on what our research overseas has turned up on our YouTube channel at www.youtube.com/USFunds.
Standard deviation is a measure of the dispersion of a set of data from its mean. The more spread apart the data, the higher the deviation. Standard deviation is also known as historical volatility. M1 Money Supply includes funds that are readily accessible for spending. M2 Money Supply is a broad measure of money supply that includes M1 in addition to all time-related deposits, savings deposits, and non-institutional money-market funds.


