 Last week I had the pleasure of participating in a webcast for Bloomberg Markets magazine regarding gold investing. It was a very insightful presentation and I suggest you view the replay at www.bloombergmarkets.com. What struck me on the call was the negativity surrounding the gold market. Call it a bubble, a frenzy or mania, there seems to be a large number of voices in the marketplace who just are not fans of gold, whether prices are moving up, down or sideways.
Naysayers started calling gold a bubble back when prices hit $250 an ounce and though gold's bull market has tossed and flung the bubble callers around for almost a decade now, their voices have only gotten increasingly louder as prices broke through $1,000, $1,200 and now $1,400 an ounce.
However, gold prices appear asymptomatic of the signs generally associated with financial bubbles.
For instance, we haven't seen price spikes. Despite rising from under $1,000 an ounce to over $1,420 over the past six months, that represents only a 0.7 standard deviation move for gold prices, according to Credit Suisse (CS). The average standard deviation move of other bubbles—Japanese equities in 1986, the tech boom in 1999, the GSCI in 2005 and gold in 1979—is 5.3. Gold's 180% move in 1979 represented a 10.3 standard deviation move, more than 14 times the magnitude we see today.
The reality is that gold doesn't possess the traits necessary for a financial bubble to form. Rodney Sullivan, coeditor of the CFA Digest, has done some great research on the history of markets and bubbles going all the way back to the 1600s. He discovered three key patterns in the 47 major financial bubbles that occurred over that time period.
These three ingredients of asset bubbles are financial innovation, investor exuberance and speculative leverage. The process begins with financial innovation, which initially benefits society as a whole. In the exuberance stage, usage of these innovations broadens; they become mainstream and attract speculation. The third step, the tipping point for a bubble to form, is when these speculators pile on massive leverage hoping to achieve greater success. This excessive leverage adds increased complexity, which mixes with irrational exuberance to create an imbalance in the marketplace. Eventually, the party comes to an end and the bubble bursts.
This is what happened with the housing bubble in the U.S. as Main Street homebuyers leveraged themselves 100-to-1, Fannie Mae leveraged itself 80-to-1 and Wall Street investment firms leveraged themselves over 30-to-1.
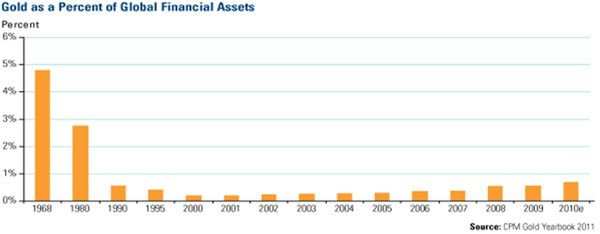
Gold as an asset class is far from being overbought by speculators. Eric Sprott recently did a fascinating presentation explaining how under-owned gold is as an asset class. Sprott wrote that despite a 30% increase in gold holdings during 2010 gold ownership, as a percentage of global financial assets, has risen only to 0.7%. That's a big increase from the 0.2% level in 2002, but Sprott points out that it's misleading because the majority of that increase was fueled by gold appreciation, not increased level of investment.
Sprott estimates that the actual amount of new investment into gold since 2000 is about $250 billion. Compare that to the roughly $98 trillion of new capital that flowed into other financial assets over the same time period.
Gold equities have seen even lower levels of investment. From 2000 to 2010, $2.5 trillion flowed into U.S. mutual funds, but only $12 billion of that went into precious metal equity funds. Of course, those figures were significantly impacted by the advent of gold ETFs during the decade. Despite the growth of the SPDR Gold Trust (GLD), which held more 1,200 tons of gold as of March 31, gold remains largely under-owned as a portion of global financial assets.
The bar chart from CPM Group shows gold as a percentage of global financial assets over time. In 1968, gold represented nearly 5% of financial assets. In 1980, the level had fallen below 3%. That figure had shrunk to less than 1% by 1990 and has remained there since. Sprott wrote, "it is surprising to note how trivial gold ownership is when compared to the size of global financial assets."
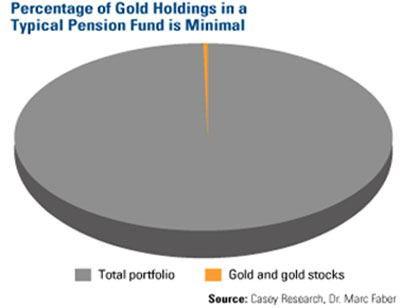
That point is magnified by the pie chart from Casey Research. Dr. Marc Faber included it in his April newsletter to show just how small a portion gold and gold stocks are for large institutional investors like pension funds.
Investors who don't think gold is a bubble but fear they've missed the boat need to look at the short- and long-term factors supporting gold at these historically high price levels. In the near-term, gold prices are being buoyed by continued weakness in the U.S. dollar.
The Trade-Weighted Dollar Index (DXY) is just above the lows experienced during November 2009 and is only 8% above the "critical" March 2008 low, according to BCA Research. BCA says the U.S. dollar's weakness is driven by four factors:
- Federal Reserve balance sheet expansion via QE2.
- Combination of low real interest rates, steeply upward-sloped yield curve and perky inflation expectations that should continue in the U.S.
- Plans by the European Central Bank to raise rates later this month.
- Willingness of Chinese authorities to allow for yuan (RMB) appreciation when the U.S. dollar is weak. This is part of what we call the Fear Trade. This graphic illustrates that the Fear Trade is a function of two separate government policies: 1.) Monetary and 2. Fiscal. Whenever there is a structural imbalance between a country's monetary and fiscal policies, gold tends to perform as a "safe haven" currency. Currently, the quantitative easing measures implemented by the Federal Reserve and the significant size of the deficit spending by the government to increase entitlements to ward off a recession have created a significant imbalance between monetary and fiscal policies. This has devalued the U.S. dollar, which, in turn, has boosted gold prices.
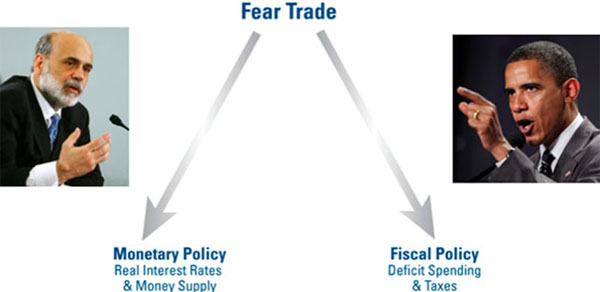
We believe that as long as the U.S. government refuses to trim entitlement and welfare programs and continues to keep Treasury bill yields below the inflation rate to battle deflation, gold will remain an attractive asset class.
Longer term, our experience shows that whenever you have increased deficit spending, rapid money supply growth and negative real interest rates—that's when the inflation rate is higher than the nominal interest rate—gold tends to perform well in that country's currency. So far we have not seen rapid money supply growth here in the U.S., but the other two factors have been the main thrust behind gold's record rise.
GFMS CEO Paul Walker echoed those drivers in an interview with Mineweb this week. Walker said that "ultra-low interest rates, macroeconomic dislocation, fears of global imbalances. . .the wrath of these things still remain solidly in place and that's really the bedrock of the gold bull rally."
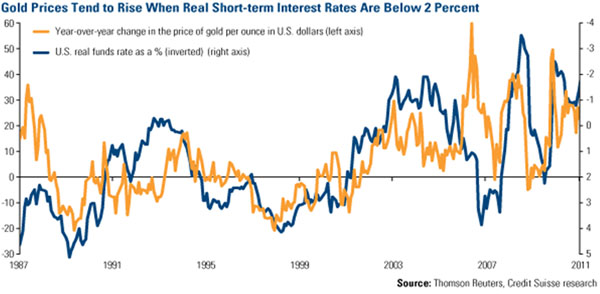
CS says the combined $6.3 trillion of excess leverage in the G4 economies (U.S., eurozone, Japan and Great Britain) means that their central banks will be forced to push real interest rates down to abnormally low levels. You can see from the chart that this is quite bullish for gold prices. Any time the real Fed funds rate is below 2%, gold tends to rise.
Current projections from the Congressional Budget Office (CBO) have the U.S. federal deficit at $1.5 trillion this year. To show the effect this has had on gold prices, we overlaid the rise in U.S. federal debt with the price of gold.
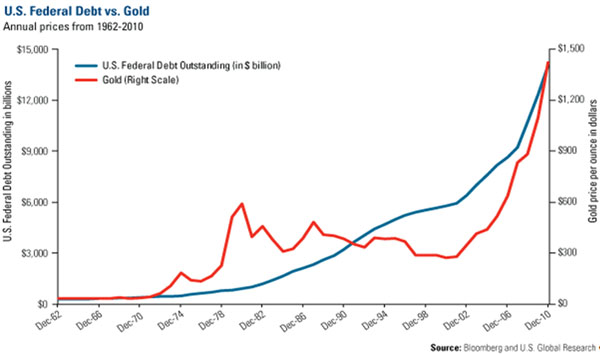
You can see from the chart that gold's bull run began in 2002, about the same time federal debt began to rise significantly. Gold played catch up at first, but the two have tracked each other rather closely. Since 2002, gold prices have risen 308% versus a 119% increase in federal debt. This means that gold's sensitivity to a rise in federal debt is just over 2-to-1. With lawmakers in Washington, D.C. still squabbling over where and by how much to cut the budget, it's unlikely the federal debt level will recede any time soon.
This is very constructive for long-term gold prices, but just how bullish depends on who you ask. The team at CS sees gold at $1,550 per ounce by year-end. BCA estimates gold to remain in the $1,400-$1,600 range in 2011. Walker of GFMS said he believes gold will surpass the $1,500 mark by year-end because "all of the structural factors supporting gold are in place." Perhaps the most bullish forecast has come from Rob McEwen, former gold analyst and founder of Goldcorp Inc. (TSX:G; NYSE:GG), who said late last
year, and reiterated last week, that he thinks gold could hit $5,000 per ounce in the next three to four years.
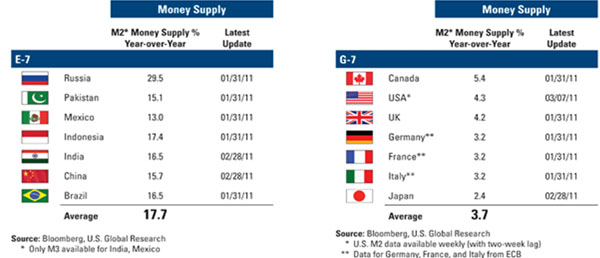
It's important to remember the strong cultural attraction that many people in emerging countries have toward gold. It's a much stronger connection than that of the developed world and essential for rising gold demand.
We like to compare the G-7 countries to our E-7—the world's seven most populous nations. Interestingly, the G-7 is 50% of global GDP but only 10% of the total global population. The E-7, on the other hand, represents roughly 50% of global population but only 18% of global GDP. We would like to point out that money supply and GDP per capita is rising substantially faster in the E-7 than it is in the G-7, 17.7% money supply growth in the E-7 versus 3.7% in the G-7. If money supply growth in the E-7 continues at a rate of 15% or more for the E-7, it would be a strong catalyst for higher gold prices.
In conclusion, based on the above factors and trends, we believe gold could double over the next five years.
For more updates on global investing from Frank and the rest of the U.S. Global Investors team, follow us on Twitter or like us on Facebook. You can also watch exclusive videos on what our research overseas has turned up on our YouTube YouTube channel.
Standard deviation is a measure of the dispersion of a set of data from its mean. The more spread apart the data, the higher the deviation. Standard deviation is also known as historical volatility. M2 Money Supply is a broad measure of money supply that includes M1 in addition to all time-related deposits, savings deposits and non-institutional money-market funds. The U.S. Trade Weighted Dollar Index provides a general indication of the international value of the U.S. dollar. The S&P GSCI Spot index tracks the price of the nearby futures contracts for a basket of commodities. The following securities mentioned in the article were held by one or more of U.S. Global Investors family of funds as of 12/31/10: Goldcorp, SPDR Gold Trust (GLD).


