

Most of the debate over the rising cost of fuel has centered around its potential inflationary impact on the economy. What many observers seem to be missing is that within the context of the long-wave cycle, a rising oil price is actually deflationary and can be devastating to the economic outlook. In this commentary we'll see how deflation is the real threat to the economic recovery.
Some background is in order before we look at the potential impacts of the deflation. There are three essential ways of analyzing asset prices: technical, fundamental and cyclical. We focus primarily on the technical approach with the longer-term cycles providing additional basis for our analysis of the equity market. The yearly cycles set the stage for the major market trend with the fundamentals serving to fill in the details behind the market's movements.
The family of cycles we utilize is the Kress cycle series of 120 years. The 120-year Kress cycle is the composite of all the lesser component cycles and is scheduled to bottom in later 2014. It's known as the Grand Supercycle but Mr. Kress has taken to calling it the Megacycle. The 120-year cycle includes two 60-year master supercycles, which correlate to the basic economic cycle, or primary macroeconomic cycle. The 60-year cycle includes two 30-year mini economic cycles, or secondary macroeconomic cycles.
Also included in this series is a 12-year cycle, which Mr. Kress identifies as the primary directional cycle. The previous 12-year cycle bottomed in September/October 2002, ending a vicious bear market in stocks. The current 12-year cycle peaked in September/October 2008, which coincided with the worst part of the credit crash. Within the 12-year cycle is a secondary directional cycle, the 6-year cycle. The 6-year cycle takes on special significant right now as it is the only one of the major yearly cycles currently in the rising phase this year and is scheduled to peak around late September/early October this year.
In a recent report Mr. Kress wrote, "The relationship between the 30-year secondary macro and the 12-year microeconomic cycles conveys the current underlying economic strength." Keeping in mind that the final 12.5% of a cycle's duration is the "hard down" phase, Kress points out, "Applied to the 30-year cycle is 3 ¾ years, and retroactively from later 2014 is early 2011. Regardless of the time of the peak of the 12-year cycle, adding 12 years to the peak of the 30-year cycle, the market conveys underlying residual economic strength. The median peak for each of the four 30-year cycles of the 120-year cycle are: 1909, 1939, 1969 and 1999. Adding 12 years to each peak are 1921, 1951, 1981 and 2011."
This is another way of breaking down the 120-year megacycle and what Kress has done is to break the 30-year component of the cycle into 12-year segments. For instance, he looks at the period between 1909 and 1921, which encompassed part of the original 30-year cycle dating back to the previous 120-year cycle bottom of 1894. The period 1909 to 1921 saw a rather strong overall advance in stock market prices, which makes sense due to the fact that the 120-year cycle that began after 1894 was still in its relative infancy.
The next 12-year segment was between 1939 and 1951. The year 1939 was a 30-year cycle peak year but the underlying 120-year cycle advance was still well underway. This resulted in the 1939-1951 period showing gains in equity prices and the overall stock market level at the end of 1951 was substantially higher than it was in the previous 12-year period of 19091921.
The next 12-year period was between 1969 and 1981. This period didn't show quite as much upside bias as did the previous two 12-year periods but it was higher nonetheless.
The latest 12-year period is between 1999 and 2011. The last 30-year cycle of the current 120-year megacycle peaked in 1999. Since then, the stock market has struggled on a longer-term basis and the current market level is 15% below the 1999 terminal high. The chart below, from a recent Kress report, illustrates this phenomenon.
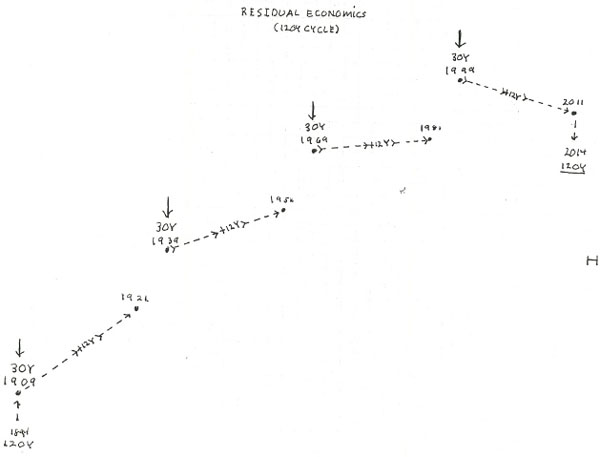
Kress concludes, "Clearly, on a mega long-term basis, the market has been 'rolling over,' and is beginning its historic 'hard down' phase of the fourth and final 30-year macroeconomic cycle of the mega 120-year cycle."
The implications of this analysis are of paramount importance for the long-term investor. The impact of the 30-year, 60-year and 120-year long-term cycles is decidedly deflationary in the overall scheme of things and this will be made abundantly clear as we head closer to the cycle's final bottom in 2014.
In the news headlines, we're finally seeing the return of optimism on the economy's prospects. Retail sales across many regions of the nation have reached the highest point since 2007 before the financial crisis began. Economists are prone to see this as good news but as any forward-looking investor knows, good news isn't usually good for the future outlook. It's merely the result of yesterday's momentum and has already been discounted by the financial market.
For the last three years, fear and pessimism have prevailed. This widespread pessimism was actually beneficial to the economic outlook as it kept producers and consumers from over-spending, over-investing and over-producing. Now that the economy's prospects have seemingly improved (at least on the surface), producers, investors and consumers alike are becoming less cautious. This will set up the next economic and financial market top at some point. The important thing is not to get too caught up in the headlines, which can easily cause one to make bad economic decisions at critical junctures.
The problem that now confronts the economy is high commodity prices. The rising cost of oil alone will push up retail prices for a broad array of goods and services in the coming months. The question that analysts have been asking lately is whether the rising oil price will be inflationary or deflationary. The rising oil price would be deflationary if consumers react to it by reducing discretionary spending.
A recent headline in The Wall Street Journal shed some light on this conundrum: "Families Slice Debt to Lowest in 6 Years." The article went on to say that, "U.S. familiesby defaulting on their loans and scrimping on expensesshouldered a smaller debt burden in 2010 than at any point in the previous six years, putting them in position to start spending more."
The recent headline optimism has indeed led to increased consumer spending in some areas of the retail economy but this will quickly reverse once consumers begin pricing in the impact of increased fuel costs on their budgets. A continuation of the crude oil price rally will have a definite deflationary impact in coming months, particularly when the 6-year cycle peaks later this year and is no longer supportive of the economic recovery.
The secondary theme highlighted by the WSJ article is that consumers still have the mindset of debt reduction, which is a spillover from the credit crisis. A contraction in consumer credit is decidedly negative for the retail economy, longer term, and is deflationary. This theme will re-emerge later in the year when the 6-year cycle peaks and the longer-term cycles begin exerting a bigger toll against the financial market and the economy.
Cycles
Over the years, I've been asked by many readers what I consider to be the best books on stock market cycles that I can recommend. While there are many excellent works out there on the subject of technical and fundamental analysis, chart reading, etc., precious few have addressed the subject of market cycles. Of the relatively few books on cycles that are available, most don't even merit mentioning. I've read only one book in the genre that I can recommendThe K Wave by David Knox Barkerbut even that one doesn't deal directly with stock market cycles but instead with the economic long wave. I'm pleased to announce, however, that after nearly 10 years of research and one year of writing, I've completed a book on the subject that I believe will meet the critical demands of most cycle students and is available for sale The Stock Market Cycles.
Clif Droke is the editor of the three times weekly Momentum Strategies Report newsletter, published since 1997, which covers U.S. equity markets and various stock sectors, natural resources, money supply and bank credit trends, the dollar and the U.S. economy. The forecasts are made using a unique proprietary blend of analytical methods involving cycles, internal momentum and moving average systems, as well as investor sentiment. He is also the author of numerous books, including most recently The Stock Market Cycles. For more information visit www.clifdroke.com.


