

It was also clearly a break away from the dollar as gold began jumping up in all currencies. This is when the bull market started heating up and gold never looked back until it surpassed the 1980 record high in 2008.
The financial crisis pushed the gold price down in the sharpest correction in the bull market, yet gold closed 2008 up on the year, which was only bettered by bonds at the time. Most impressive, it didn't take gold but a few months to reach a new high once again.
Most important and the reason why we are going over the bull market is because the gold price has been on a tear with not even a 14% decline since the crisis low in Nov 2008. Gold entered a stronger phase of the bull market along the way in September 2009, and once again it never looked back.
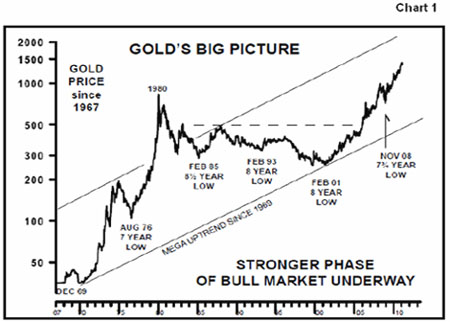
Interestingly, the Nov 2008 crisis low was near the recurring eight-year lows that gold has followed since the 1970s. That is, gold tends to reach a low every eight years (see Chart 1). If this pattern continues, this means that gold has several more years ahead for an exciting bull rise to develop. In many ways it feels like 1976 again. . .only this time around the world is more complex and involved. The emerging world is carrying the load, while the developed world strangles on debt.
Bull: Time for a Rest
For now, however, gold is in a downward correction that began with the new year and it's been moderate, only declining 7% so far. Is that all there is or will gold decline further? That's the big question. Will it be a decline similar to the one last February when gold fell 13.30%, or will it be milder, like in the summer when gold lost about 8%? We'll soon find out, but a correction at this point is not at all unusual. In fact, gold's strong rise was overdue for a normal correction.
Gold Timing
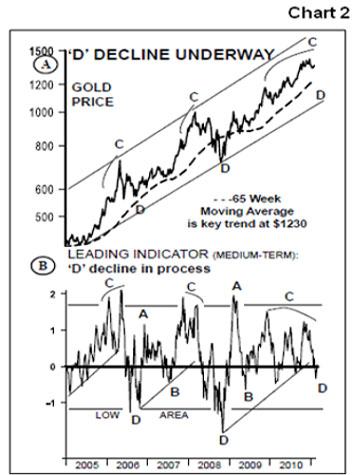
The key now is to watch the guidelines to measure gold's weakness. Our best guideline is shown on Chart 2. This indicator is our favorite in helping to time intermediate moves in the gold price.
The best rise in gold's bull market is a rise we call "C." The latest one had been in process since April 2009. This rise peaked on January 3rd. This means gold rose almost 64% in this 21 month time period a super rise indeed and the strongest C rise of the last 10 years.
Our focus now is on the current decline, we call D and to measure its likely depth. A 10%15% decline would be a healthy one and it would still show overall bull market strength. This means a decline to the $1280-$1200 level would be a normal decline within gold's strong bull market. This level also coincides with the 65-week moving average, the major support level, now at $1,230. D declines tend to fall to this average, but the exception was the 2008 extreme during the financial meltdown. Whether this decline ends up being mild or more severe, it's providing a good buying opportunity. Use upcoming weakness to buy with both hands.
Mary Anne & Pamela Aden are well-known analysts and editors of The Aden Forecast, a market newsletter named '2010 Letter of the Year' provides specific forecasts and recommendations on gold, stocks, interest rates and the other major markets. For more information, go to www.adenforecast.com.


