

However, Mr. Market's appetite for oil bears has diminished tremendously over the past week as the U.S. dollar and geopolitical news coming out of Egypt pushed oil prices lower. Mr. Market's appetite is always changing it would seem, but right now he is enamored with S&P 500 bear meat and not really that interested in the oily bear meat. The question remains whether his tastes will change in the near term, or if he will continue to turn S&P 500 bears into fodder and steak.
S&P 500
With all metaphors and short stories aside, the price action in the S&P 500 for the past several months has been devastating for bears. Going back to November of 2010, every key resistance level ended up being taken out by the bulls and prices pushed higher and they push higher still. Last Friday's close pushed prices to new recent highs and in time prices may challenge long-term overhead resistance levels. The table below shows just how extended the equity market is.
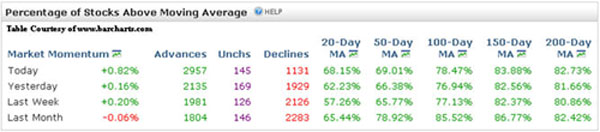
As can be seen above, 82.73% of all stocks are currently trading above their 200-period moving average and over 68% of equities are above the 20- and 50-period moving averages. While this certainly does not mean that prices are going to rollover, it is hard to refute the conclusion that prices in the equity market are overbought.
A quick glance at the SPX daily chart reveals the recent price action.
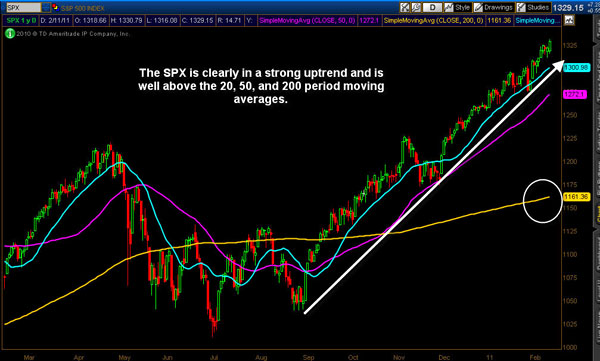
It is obvious when looking at the SPX daily chart that prices are extended to the upside in this bull market run. However, as I pointed out in a recent article the distance between current price action and the 200-period moving average is significant. There are a total of 167.79 SPX points between Friday's close at 1329.15 and the 200-period moving average at 1161.36. Based on Friday's closing price a reversion to the mean (200-period moving average) would produce a decline of around 12.62%. The SPX weekly chart is shown below.
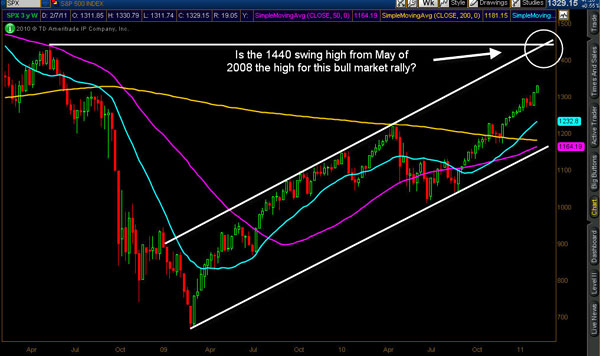
It is worthy of note that the May 2008 swing high of 1,440 coincides with the upper band of the rising channel that is obvious when looking at the weekly chart of SPX. While price action may or may not get to SPX 1,440 during this bullish run higher, it's likely not coincidental that both key trendlines coincide at the same price point. The intersection of the long term rising trendlines corresponding with the upper band of the current rising channel and the 1,440 swing high may be something of import, or it might turn out to be nothing. However, it certainly is an eerie coincidence on the chart if you believe in coincidences.
I am still convinced that stocks need to pull back at some point if they are to continue higher. Consolidation or a 5%10% correction would likely be healthy for the market and might prove to be a launch pad for another thrust higher in price. From the underlying strength in the domestic market, a correction or pullback will likely be an opportunity to get long barring price breaking down through the lower level of the rising channel located on the weekly chart.
I'm not sure I'm going to get involved in the short side if we see bearish price action in coming weeks. Instead, I will likely be looking for opportunities to get long equities at more attractive prices. Right now, risk to the downside appears to be increasing as the S&P 500 continues to probe higher.
Light Sweet Crude Oil
Oil prices surged when Egyptian protests intensified and have sold off recently as President Mubarak has stepped down and demonstrations have turned into nationwide celebrations. In addition, the U.S. dollar has strengthened considerably the past few days, which has also put price pressure on oil. The daily chart of light sweet crude oil futures is illustrated below.
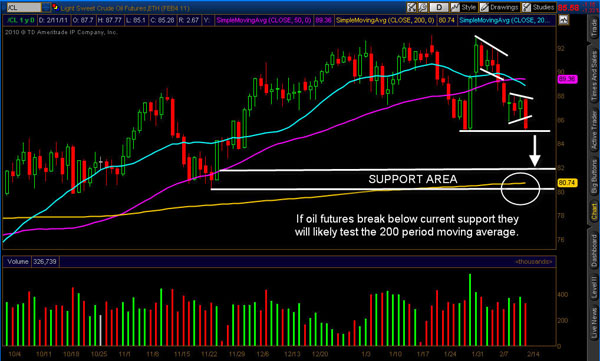
Oil prices are hanging onto a key support level by a thread and price action in the coming week could see prices push lower through the support area and an eventual test of the 200-period moving average. I'm not considering a short in oil, but I am looking at lower prices as a solid risk /reward long entry. I'm going to be patient, but envision building a longer-term trade using options to profit from a possible rally after putting in a clear bottom.
Right now, price could hold above current support levels and bounce higher, but I think the more likely scenario is a brief bounce early this week and then a flush out lower running stops and reaching panic level selling. As is customary for my trading methodology, I will be looking to buy into panic selling should that take place, however at this point I am not interested in getting involved just yet. I intend to remain cautious and will patiently wait for a low-risk, high-probability trading setup to emerge. Until then, I will be watching the price action from the sidelines letting others do the heavy lifting.
Conclusion
While it may be bear season in the equity markets as Mr. Market continues to punish the ursine, the oil futures market has produced a new home and a new river for eager bears to feed. The question remains: How long will Mr. Market punish the short traders in equities while rewarding them in the oil futures pits? Mr. Market may be losing his appetite for bear meat in equities and he might just decide to feast on some bears covered in oil. Time, as usual, will be the final arbiter; but for right now, I'm sitting on the sidelines waiting for Mr. Market to tell me his next order.
Get my trade ideas here: http://www.optionstradingsignals.com/profitable-options-solutions.php.


