

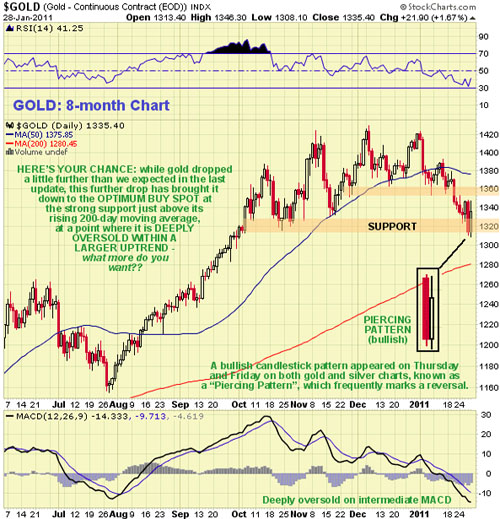
While gold dropped a little lower last week than expected in the last update, it has arrived in an area of strong support above its rising 200-day moving average in a deeply oversold condition, as we can see on its 8-month chart below. Thus it is interesting to observe that a bullish candlestick pattern, known as a "piercing pattern," appeared on its chart on Thursday and Friday, which frequently signifies a reversal.
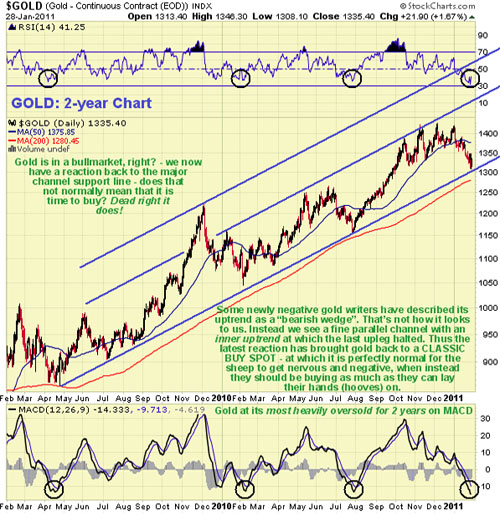
The downturn in gold and silver has not unnaturally brought bears out of hiding, and they of course are to be found in large numbers near market bottoms. The claim of some of them is that gold has been marking out a bearish rising wedge. That is not how it looks to usinstead we see a fine parallel channel with a parallel inner uptrend at which the last upleg halted. This can be seen on our 2-year chart and also how, with gold having just arrived at the lower boundary of this uptrend channel in a deeply oversold condition on its medium-term MACD indicator, we are at the optimum buy spot RIGHT NOWwhich explains the aggressive buying on Friday that completed the piercing pattern.
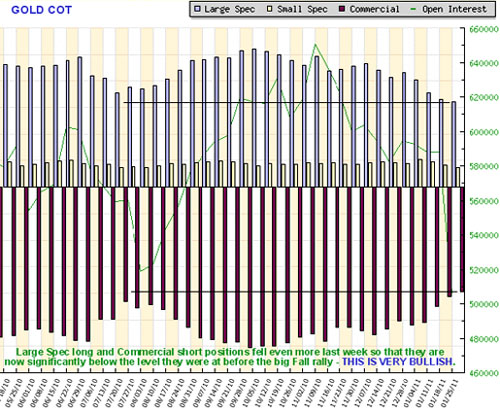
What is laughable about the bears' stance is that in addition to being completely uninfluenced by the realities detailed above, they appear to be totally oblivious to the fact that the gold COT structure is at its most bullish since at least the start of last year. As we can see on the COT chart below, the commercials' short positions and large specs' long positions are at lower levels than existed before the great fall rally in gold and silver and, in fact, are lower than at any time last year. This fact alone points to the imminent birth of a major uptrend.
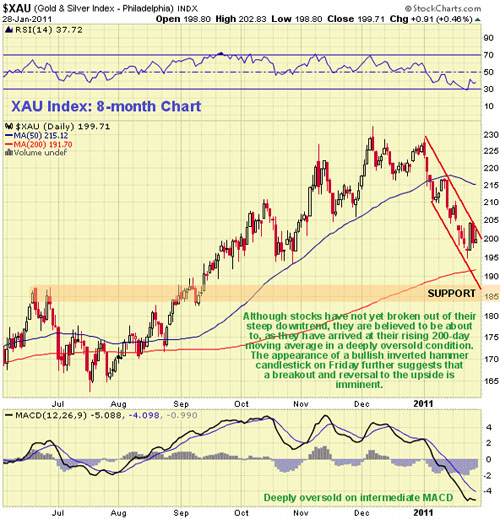
On our 8-month chart for the large stock XAU index we can see that although stocks have not yet broken out of their steep downtrend, they look set to do so very soon, as they have arrived at their rising 200-day moving average in a deeply oversold condition. The appearance of a bullish "inverted hammer" candlestick on Friday further suggests that a breakout and reversal to the upside is imminent.
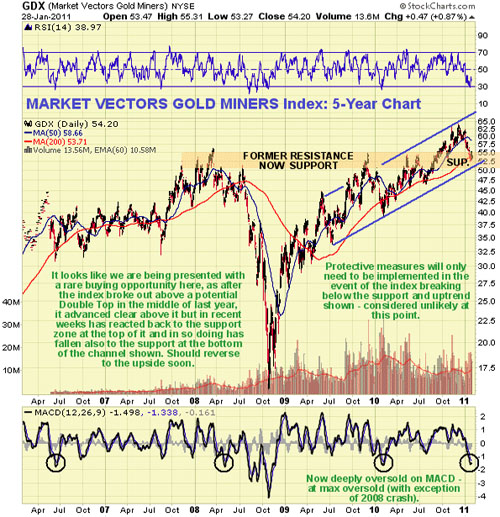
In addition we can see on its 5-year chart that the Market Vectors Gold Miners Index appears to have completed a normal post breakout reaction back to the former major resistance zone that it finally succeeded in breaking above last year, and which is now a zone of strong support, and is towards the bottom of its long-term uptrend channela classic buy spot. Only a massive market meltdown similar to 2008thought highly unlikely because of the QE optionwould create the possibility of a breakdown from this channel, and in that event we would take protective measures upon failure of the support and the uptrend channel support line shown.
We will end by making an important point. Sometimes people write in asking for me to give exact targets in price and time for gold and silver, or stocks or whateverthey want to know, for example, what price I think gold will be at in six months time. We don't work like that. To attempt this kind of precision is to imply that one knows exactly what the future holdsnone of us does and those that claim that they do are charlatans.
Wave theorists sometimes make such fatuous claims and when their targets aren't hit or are grossly overrun they try to bend their theories to make reality fit them. It's like asking a weather forecaster if it will be raining at a particular place at 10.45 am at some date four months in the future, or starting a boxing match saying to yourself: "I plan to knock him out with a right hook in the third round at the 23rd second."
Successful trading is like life itselfyou react and adapt in real time. When you drive your car, you are always ready to react to the unexpected, like a child running out into the road, even if it's your regular commute that you have done for years. Likewise, the experienced sailor making a trip across the Caribbean in the summer does not have a rigid planhe is always ready to take avoiding action or head for port in the event of a hurricane approaching. So we duck and dive and "roll with the punches," but that doesn't stop us garnering large profitswe held a raft of juniors through the Fall rally some of which racked up huge gains, then seeing the danger at the end of the year, protected our positions with puts and bear ETFs. Last week we ditched these for a big profit, mentioned as an option in the last Gold Market Update. Now we go full long and will only consider taking evasive action in the event of the long-term uptrend channels in gold and the Market Vectors Index shown above failing.
We will close with the highly pertinent and timely observation of a friend in Toronto, who has a somewhat different way with words to the writer, but who nevertheless sums up the great opportunity presented now succinctly: "Houston, we have BLAST OFF on every freaking thing that morons were selling at 30% discount last few days !!! Come in Houston, Houston are u there?. . ."
Gold Market Update


