

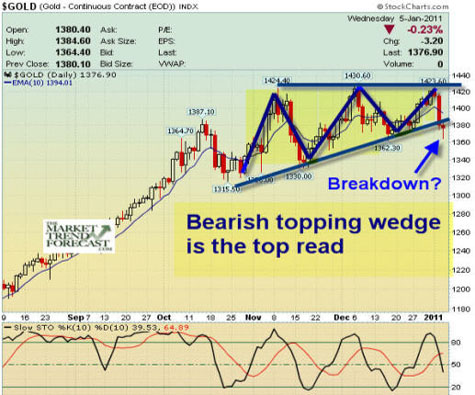
In the case of gold, we see a really muddy chart pattern over the last several weeks that to me can only be read as toppy after a near $390 rally off the February lows this year. There are no clear Elliott Wave patterns anymore over the past few weeks, and the recent drop from $1,422 to the $1,360 ranges also doesn't compute well for me if I'm a bull. I have been on the long side of gold since February of 2010, with the one intermittent bearish call I made in June before a huge drop. It looks like now is a good time for gold and silver to pause in the long uptrend, which still has about three to four years remaining if I'm right. This next pullback is likely to take gold down to $1,270$1,280, and then I will assess from there the next direction and price action. As you can see in the chart below, the recent action is toppy looking and could be read as bearish.
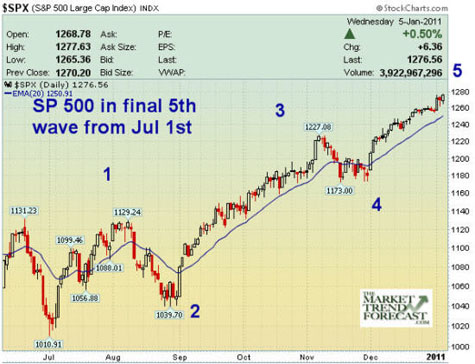
The SP500, as I have outlined near year-end 2010, is in the final stages of the advance from the summer lows of 1010 on the SP500 on July 1. The Fibonacci and wave relationships then have been quite symmetrical and I see no difference on this final leg up. The difficulty is assessing whether this final fifth wave to the upside will extend past my 1,285 targets and run to 1,315, or truncate just below and begin the correction. I am looking for about 105 points SP500 correction from the 12851315 topping areas over 710 weeks. This, too, will work off extremely bullish sentiment readings that are running at or near the same highs as the January 2010 and April 2010 highs, which I had also forecasted. The areas that would be hit hardest in the coming wave 2 correction will be small-cap stocks, so lightening up in that area and buying protection is not a bad idea to protect your long portfolio positions.
Nobody rings bells at the bottom or tops, so I look for enough clues converging at the same time, and then prepare my subscribers and myself accordingly before the major turn begins. If you would like to benefit from my forecasts, please check us out at www.MarketTrendForecast.com.


