

I digress and go back to the gold bull market. The reason I knew in August of 2009 that from $900 gold we would enter a five-year "massive" bull run is due to crowd patterns. To refresh, I see gold as being in a Fibonacci 13-year cycle up that started in 2001. The first five years not too many investors participate in the bull run because the prior 20 did nothing. By the time everyone realized in 2006 that gold mutual funds had compounded 30% a year for five years, it was too late to jump in. Of course, that is when everyone started buying gold mutual funds and stocks. The problem is the first move was over, and we had three Fibonacci years of chop with no net gains. The crowd gives up around the summer of 2009, and that is when I forecasted a huge five-year move to come. So far, gold is up over 50% in 13 months and gold stocks are up well north of that. The junior stocks started expanding in volume and price months ago, and that should have been yet another wake up call to investors.
Near term in gold, I'm looking for this current power Elliott Wave to land around $1485$1492 before correcting strongly. And the recent pivot at $1312 was yet another short-term bottom that will be followed by the last leg up since the $1155 lows this summer. Investors are now waking up and buying gold and gold stocks, and this is part of the recognition period in the last 5 years of the 13-year cycle when more and more participants get involved. This is why this gold bull is just warming up and by the time it peaks out, it will be like 1999 in Tech stocks. The demand overseas for gold and obviously in China is likely to continue for many years to come, don't be fooled by the various wave dips in sentiment.
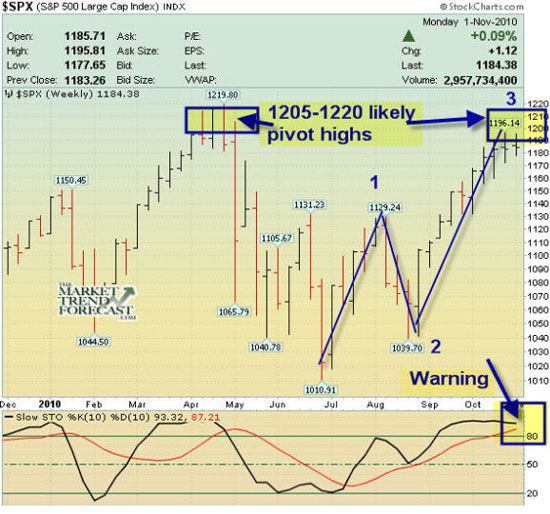
The SP500, on the other hand, is very similar since the March 2009 lows. The bears have continued to focus on Jobs reports and other ephemeral data and not the big picture. My opinion is the great bear cycle ended in March 2009 at 666 on the SP500, at least for a several year cycle up. When we hit 666, it was an exact 61.8% Fibonacci retracement of the 1974 SP500 lows to the 2000 SP500 highs. It took about 89 years to correct that 26-year move, and the pattern fits with a "wave 2" pessimistic Elliott Wave bottom. That is why the move since 666 has been stunning, because nobody sees it coming. The correction we had this summer I forecast in mid-April and ended on July 1 at 1010 on the SP500. At the level of 1010, we had a 38% Fibonacci retracement of the March 09 to April 2010 13 Fibonacci month rally, and a 38% retracement of the 2007 highs to 2009 lows. Those types of patterns are not random and in fact are big clues to get long the market. The problem is those patterns are hidden amongst the noise of the markets, CNBC and all of that useless data. Currently we are in a 3rd Elliott wave up which began at the 1040 SP500 pivot, and my forecast since has been for 12051220 before a corrective 4th wave down. Before it's all over, the SP500 may well test the 2007 highs on this new cycle up from March 2009.
Subscribers to my website get weekly updates and regular intraweek commentary as needed; please consider subscribing. We are offering a two-day only, 12 months for the price of 6 months special in celebration of the U.S. midterm elections today. Enter "1246month" in the coupon field. Your price will automatically drop to the semiannual price. You may follow us on twitter at www.twitter.com/activetrading and sign up for our free reports at www.markettrendforecast.com.


