

I've long been a believer in Elliott Wave Theory, which was developed in the 1930s by R.N. Elliott. He was a man decades ahead of his time and, to this day, his work remains revolutionary in tracking and forecasting market and commodity trends and cycles. This theory forms the basis of my market-forecasting and trading and investing work. While the crowd continues to wait for the next crash, the Elliott wave patterns I've been outlining have continued to foretell a bullish move of possibly historic proportions. Taking advantage of this type of move means you need to tune out the noise from CNBC, all of the jobs data and the negative mantra. Everyone knows that stocks climb a wall of worry, but you must have a method that lets you know to stay long and where best to invest during a super cycle Elliott bull wave pattern as we are in now.
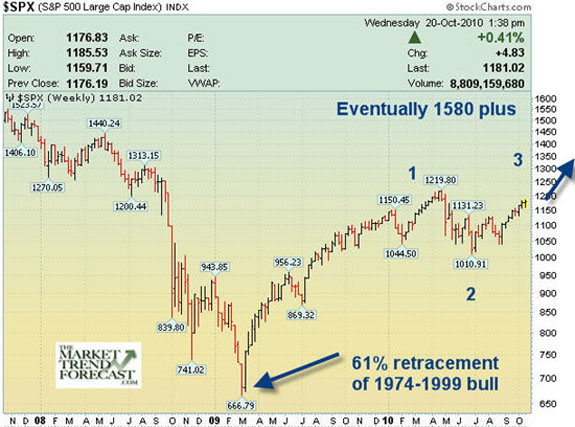
My theory back in late February 2009 was that the market was about to bottom and nobody knew it. I wrote an article on 321gold to outline my reasoning and had a chart showing 1,200 on the SP500 as a likely target. At the time, the SP500 was trading around 720 and had not yet completed its drop to 666 but was within a few weeks. Interestingly, to me anyway, at 666, the SP500 bottomed and not randomly at all! That 666 figure was an exact 61.8% Fibonacci retracement of the 1974 lows to the 2,000 highs bull cycle.
Often crowds act in patterned behaviors that are formed around Fibonacci mathematics. Typical retracements are 38%, 50%, 61.8%, or even 78.6%. Combining Elliott Wave patterns with Fibonacci sequences allows me to confirm, or help firm up, a forecast. That drop over five Fibonacci months completed a multiyear cycle from the 2000 highs to the 2009 lows and it did so right at a clear Fibonacci pivot point. This is why I believe the next many years will be very bullish for stocks, and most investors will not be on board.
Those Fibonacci and Elliott Wave patterns gave me the heads up to start turning bullish, coupled with the sentiment readings that were equally as bearish as the October 2002 bottoms. In addition, there was way too much discussion about deflation. The rubber band, in essence, was stretched so far to one side on sentiment gauges and deflation talk that just a slight shift toward inflation would move stocks much higher.
Fast forward to October 2010, and we now see the ravages of inflation becoming very apparent some 18 odd months later. Gold is at $1,350 per ounce, Silver is at $24/oz., the SP500 is heading back to 1,200 and copper, corn, sugar and coffee are all at huge highs. What investor's don't understand is that stocks are one of their best asset classes in the earlier periods of an inflationary shiftwhat I would call an 'inflationary period of prosperity worldwide.' Elliott Wave patterns most recently that I outlined on my market forecast service alerted my subscribers to prepare for a massive bull run once the 1,094 area on the SP500 crossed to the upside.
Given the understanding that inflation would become the new trend, we took multiple positions in gold stocks and rare earth metals stocks ahead of the curve. Some of our recent picks included Hudson Resources at $0.63 in August, now trading at $1.30. Others include BORN, a Chinese corn-based producer of Alcohol, which was at $8 and ran to $19 within seven weeks. We were investing in rare earth stocks almost 12 months ago, including REE at $1.80, and it's now trading over $13/oz. a share! My ATP service has been positioning our subscribers into Tasman Metals at $1.54, now $2.28 and Quest Rare Minerals at $4.10, now $5.50. These moves are happening in stunningly fast, so being positioned ahead of those moves is crucial.
Gold and gold stocks have obviously had a very strong move to the upside. Back in August of 2009, I forecasted a massive five-year advance in gold and gold stocks. This again was entirely based on the Elliott Wave patterns I recognized and crowd behavior. Investors will recall the 13-year bull market in tech stocks that started in 1986, when Microsoft went public, and ended in 1999, when AOL was sold to Time Warner for $150 billion. Well, nobody participated during the first five years of the tech bull, except the early investors. Intel and Dell also went public, along with EMC and others.
By the time 1991 rolled around, investors kind of woke up and start buying. The problem was they were late, missing the first five years. At that point, tech stocks bucked and kicked up and down with no net gains for three years. Investors gave up again in 1994, and then we began a torrid 5-year rally to 1999. It was not until the last 12 months of that rally that everyone piled inherd behavior in its finest form.
We are seeing the same patterns now in the precious metals areas of the market. The final five years started in August of 2009, kind of like 1994 in tech stocks. The first five years were 20012006 when gold funds returned 30% compounded per year; by the time everyone got on board, the funds did nothing for the next three years. Everyone lost interest, gave up and that was the August 2009 buy signal.
Bringing us full circle, investors continue to shy away from this stock bull market following the five-month crash of nearly two years ago. This is exactly the psychology present in an early stage bull market.
Going forward from here, I look for the SP500 to hit 1,220 at the top of an Elliott Wave three from the 1,040 lows in summer. That will be followed by a correction pattern, and then we will resume the advance to new highs on this bull market stretch from March of 2009. Gold should work its way up to $1,4801,520 if I'm right on its bull move from the $1,155 lows this June.
The following chart of the SP500 on a long-term basis is currently in the third wave up from the 1,010 lows on July 1st. This wave pattern is powerful and should run to at least 1,220 intermediately. In time, this multiyear bull market could power to all-time highs and really upset the bears.
Inflation is taking hold around the world, and stocks are one of your best asset classes to participate. You can follow along by registering for free weekly updates at www.markettrendforecast.com or www.activetradingpartner.com. If you'd like to follow a few of my trading ideas and forecasts in real time for free, you can go to our twitter feed at http://www.twitter.com/activetrading. Some of the recent tweets have had returns of 30%75% within 510 days just in the past 30 days or so.
David Banister
Market Trend Forecast


