

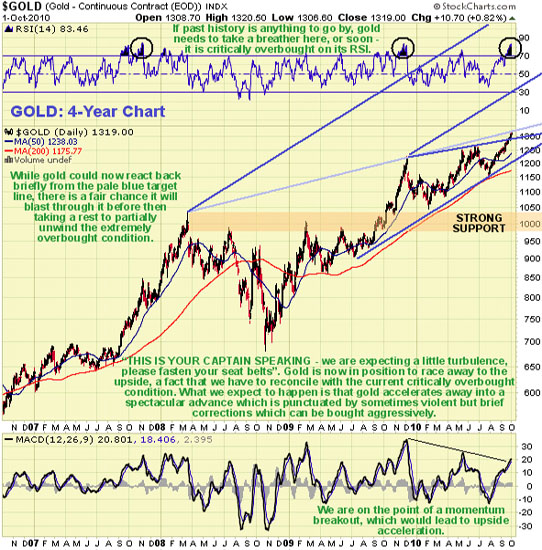
On its 4-year chart, we can see how gold has broken above the top line of the potential wedge drawn across the highs from last December. The pale blue trendline shown, drawn from the early 2008 highs, does not mark the top boundary of a true wedge but is believed to have some significance and MAY trigger a temporary reaction, which the current critically overbought condition certainly makes very possible. Gold is deep into critically overbought territory on its RSI indicator shown at the top of the chart but still has substantial upside leeway on its MACD indicator shown at the bottom of the chart, which it should be noted can get overbought and stay overbought for a long time as the price continues to ascend.
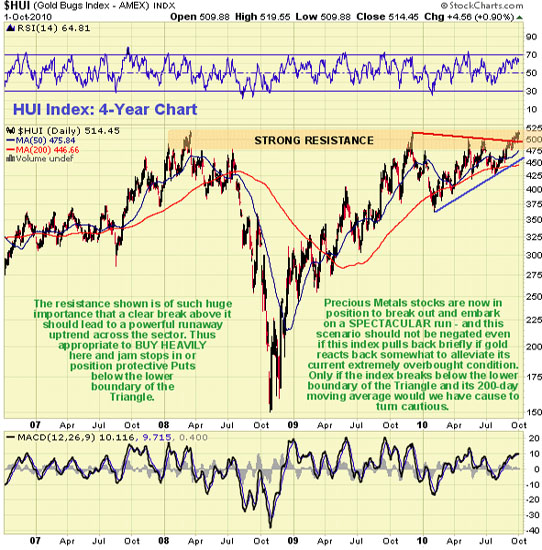
So, we have a situation where gold is in position to accelerate away to the upside, but is at the same time critically overbought on various short-term indicators, but is nowhere near so overbought on intermediate indicators. What are we to make of this? The probable scenario here is that now gold has broken out above the resistance at the top return line of the wedge, as described, it accelerates away to the upside, the advance being punctuated by brief "air pocket" reactions that could be increasingly violent. The current critically overbought state makes such a reaction likely either immediately or very soon. These reactions may be deeply unsettling for those long, but if the reason for them is known in advance and they expected, they can be used by traders to pyramid positions at better prices. The MINIMUM target for this advance is the lower parallel return line shown, which is currently in the $1,500$1,600 area, which is Jim Sinclair's long-standing target that looks not just easily achievable but actually quite modestour upper parallel return line gives a MUCH higher target. Small wonder then that PM stocks look so attractive here, as despite their gains of recent weeks, they haven't even collectively broken out yet! Many big weighty gold stocks look set to make their biggest gains in a long time and their gains can be leveraged by means of options and the better juniors and mid-caps look set to go ballisticwe haven't been able to write them up fast enough on www.clivemaund.com.
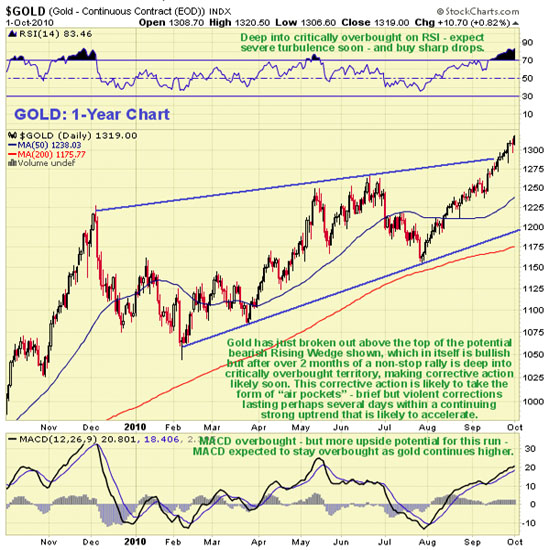
The 1-year chart for gold shows recent action in more detail. On this chart, we can see that, although the RSI is showing a critically overbought extreme calling for consolidation or reaction soon, the uptrend to date has been steady and considerably less steep than that of last fall or the big 20072008 rally shown on the 4-year chartcircumstances we interpret as allowing for acceleration of the uptrend, despite a probable "air pocket" reaction soon. Thus, the advance is likely to steepen considerably, with occasional scary but brief reactions along the way. It is thought that it will be a good strategy to buy aggressively on any such sharp down days, as gold is likely to turn on a dime and go roaring up again.
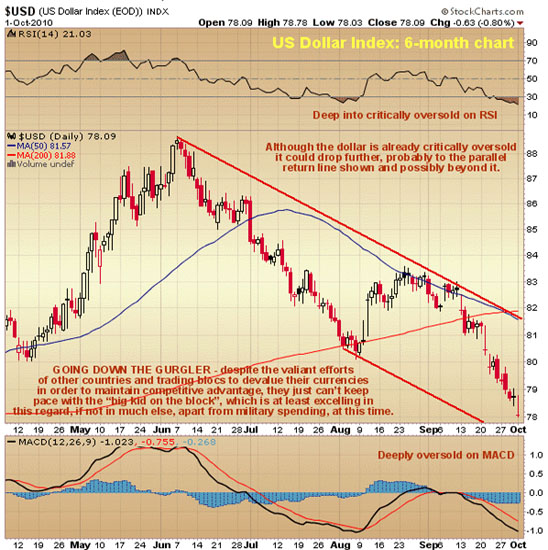
With the precious metals so strong in recent weeks, it is hardly surprising to observe on our 6-month for the U.S. Dollar Index that it has been in ragged retreat. The U.S. has always had a reputation for doing things in style; and, when it comes to currency debasement, no one is going to steal a march on them.
Meanwhile, other countries are frantically trying to keep up with their own competitive devaluations and can be expected to increasingly follow the U.S. example and indulge in a little quantitative easing (QE) of their own. Compared to what the U.S. is doing, this is "lemonade stand" stuff; for, as we can see on the U.S. Dollar Index chart, the dollar is definitely winning the "race to the bottom" at this time. The U.S. has every incentive to win this race, as it has racked up astronomic debts and obligations that are best dealt with by devaluing the currency. An outright headline-grabbing sovereign default by the U.S. would certainly not be what one associates with Triple A ratings and might result in the country being "put in the doghouse" economically, not to mention getting the Tea Party mob stirred up. So, it's far better to engage in a creeping default by simply creating more and more money. With most other countries aiming to follow suit, it's small wonder the outlook for gold and silver is now so rosy. It's kind of sad for the naive, trusting overseas holders of U.S. Treasuries. The deflation dragon, which had been lurking menacingly in the background earlier this year, is being suffocated in a sea of newly created cash.
Hyperinflation? We'll deal with that problem when we come to it. When the United States is completely bankrupted, the surplus holding Asian Tiger economies will ride to the rescue, buying up corporations and vast tracts of real estate at pennies on the dollar; thus, putting America to work againfor new masters OUTSIDE the country, albeit at decidedly competitive rates of pay. See?no big military required.


