

With world stock markets looking increasingly fragile in the face of rising interest rates, especially in the U.S., and the traditional crash season at hand, this is a good time for us to take an updated look at the charts for the broad stock market. We last took a good look at the broad market on 28th August when we observed that it has been in a bear market since the start of the year.
The market is rounding over and gradually accelerating to the downside beneath a Dome top pattern, just as it did in 2008.
However, up until now, the decline has been relatively gradual. We are looking at it again now because of the growing risk of it accelerating away to the downside. Here it should be pointed out that, given the state of the economy and the outlook, the market should be much lower, and it is only because of Fed meddling and buying the market, perhaps through Blackrock and Vanguard, etc., that it isn’t.
We know that they can create unlimited money for this purpose, which is why we have been wary of shorting the market, and then they stick society at large with the bill via increasing inflation.
We have continued to buy and trade stocks in recent weeks because even though the overall trend of the market is down, individual stocks can go up for their own reasons, but if we see the broad market pick up momentum on the downside, that will become more difficult and given where we are in the market cycle, albeit a Fed distorted one, it will probably behoove us to figure out some ways to make money out of a falling market.
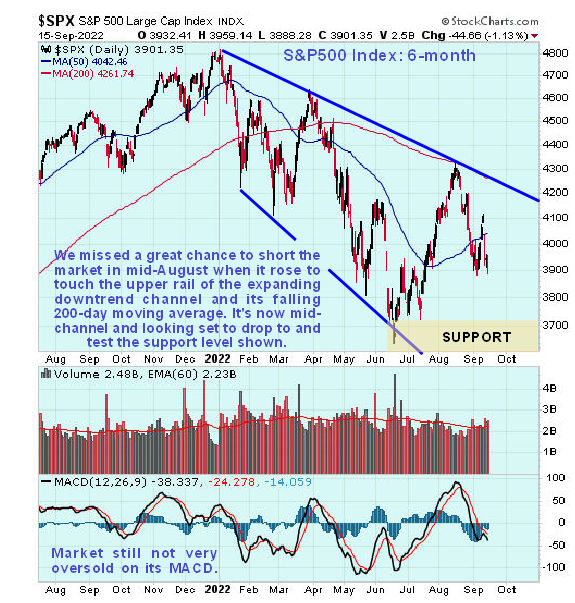
Looking at the latest 6-month chart for the S&P500 index, we can see that the market has been falling within an expanding downtrend channel which it is currently in the middle of and heading toward the support shown above its lower boundary.
If this support fails, then we can expect it to head toward the lower channel boundary at least. We missed a great opportunity to short it when it touched the upper rail of the channel in mid-August and also the falling 200-day moving average. Before leaving this chart, note that it is still not very oversold on its MACD indicator.
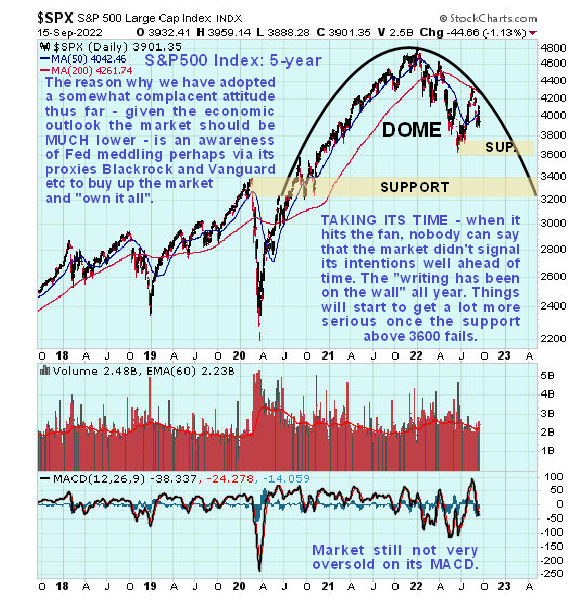
In August, the 5-year chart helped us to determine that we are in an established bear market, and this chart makes very clear what is going on. The market is rounding over and gradually accelerating to the downside beneath a Dome top pattern, just as it did in 2008.
This chart portends the eventual failure of the support levels shown, leading to a severe decline or a crash, which would hardly be surprising considering the abysmal state of the economy and worsening outlook.
Downside risk will increase significantly once the support is shown at above the 3600 level fails. Again it is worth noting that the market is not oversold on its MACD on this chart, which means that technically there is plenty of room for it to drop.
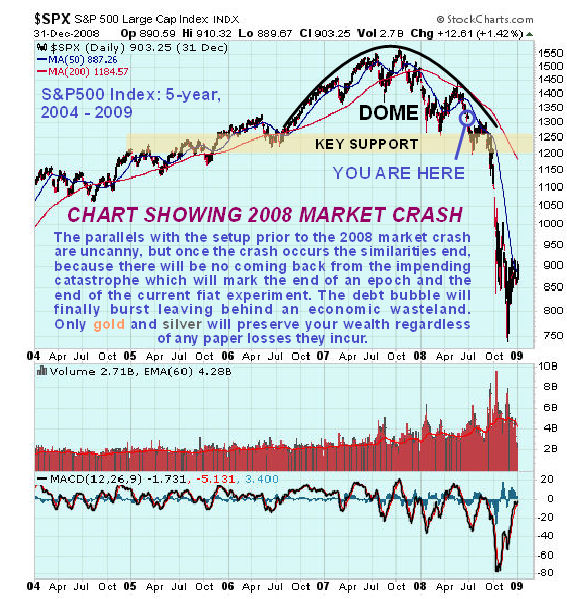
On the 5-year chart for the S&P500 index that includes the period of the 2008 market crash, we can see the uncanny and frightening similarity between our 5-year chart for the S&P500 index now and this chart.
Little needs to be said about this as the similarities are so obvious, but it is interesting to see how the rally toward the Dome boundary in August of this year corresponds to a very similar rally back in May/June of 2008 before the market then rolled over and dropped as it is now doing but at that time, after breaking a support level and dropping to new lows it stabilized for a few months and had a last gasp rally before finally breaking down and cratering when the crash phase occurred.
Before packing up and heading for the hills, I recommend that you obtain as much physical gold and silver as you can.
Compare these two charts, and you will have yourself a roadmap. If the pattern repeats, which it won’t necessarily, then we could see it pan out in a similar manner. A final, very important point to note is that after the market crashed in 2008, the Fed opened the spigots and flooded the system with repeated bouts of QE. It can’t do that this time as the system is already maxed out with all tools in the toolbox having been used, so there won’t be any similar recovery, especially as the debt market will have blown to smithereens leaving behind an economic wasteland.
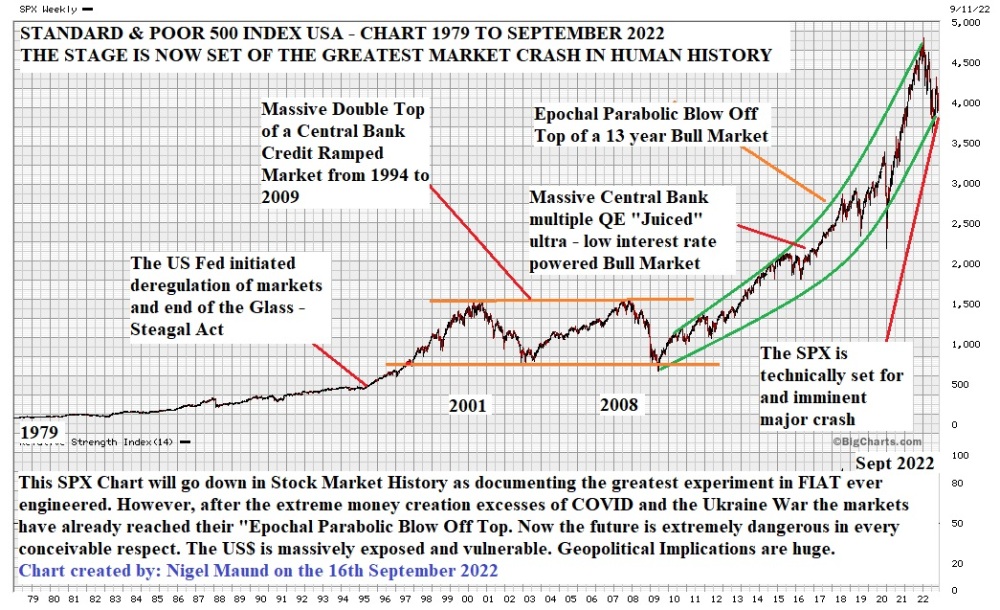
We will end this article with a very long-term chart of the S&P500 index submitted to me by my brother Nigel Maund just this morning. I believe Nigel’s lurid and frightening analysis and description are broadly correct, and the only reason that I have been relatively complacent up to now is not wanting to be right too soon — these scenarios take time to play out, although time is now running out fast.
Before packing up and heading for the hills, I recommend that you obtain as much physical gold and silver as you can, and don’t worry about the possibility of a drop in the paper price of gold and silver during the early stages of a market crash, because what matters is their intrinsic value, the paper price at this stage is irrelevant – it’s no good being able to theoretically buy them at a lower price if there isn’t any to buy which is why these metals are expected to break ranks with the stock market at some point and soar.
When it hits the fan, you will be able to trade physical gold and silver for things you need, especially silver, which is more useful in this regard, whereas fiat banknotes could well become utterly worthless.
| Want to be the first to know about interesting Special Situations, Gold and Silver investment ideas? Sign up to receive the FREE Streetwise Reports' newsletter. | Subscribe |
CliveMaund.com Disclosures
The above represents the opinion and analysis of Mr. Maund, based on data available to him, at the time of writing. Mr. Maund's opinions are his own, and are not a recommendation or an offer to buy or sell securities. Mr. Maund is an independent analyst who receives no compensation of any kind from any groups, individuals or corporations mentioned in his reports. As trading and investing in any financial markets may involve serious risk of loss, Mr. Maund recommends that you consult with a qualified investment advisor, one licensed by appropriate regulatory agencies in your legal jurisdiction and do your own due diligence and research when making any kind of a transaction with financial ramifications. Although a qualified and experienced stock market analyst, Clive Maund is not a Registered Securities Advisor. Therefore Mr. Maund's opinions on the market and stocks can only be construed as a solicitation to buy and sell securities when they are subject to the prior approval and endorsement of a Registered Securities Advisor operating in accordance with the appropriate regulations in your area of jurisdiction.
Disclosures:
1) Statements and opinions expressed are the opinions of Clive Maund and not of Streetwise Reports or its officers. The author is wholly responsible for the validity of the statements. Streetwise Reports was not involved in any aspect of the article preparation. The author was not paid by Streetwise Reports LLC for this article. Streetwise Reports was not paid by the author to publish or syndicate this article.
2) This article does not constitute investment advice. Each reader is encouraged to consult with his or her individual financial professional and any action a reader takes as a result of information presented here is his or her own responsibility. By opening this page, each reader accepts and agrees to Streetwise Reports' terms of use and full legal disclaimer. This article is not a solicitation for investment. Streetwise Reports does not render general or specific investment advice and the information on Streetwise Reports should not be considered a recommendation to buy or sell any security. Streetwise Reports does not endorse or recommend the business, products, services or securities of any company mentioned on Streetwise Reports.
3) From time to time, Streetwise Reports LLC and its directors, officers, employees or members of their families, as well as persons interviewed for articles and interviews on the site, may have a long or short position in securities mentioned. Directors, officers, employees or members of their immediate families are prohibited from making purchases and/or sales of those securities in the open market or otherwise from the time of the decision to publish an article until three business days after the publication of the article. The foregoing prohibition does not apply to articles that in substance only restate previously published company releases.


