

The last update was wrong. Gold was expected to drop with the stock market, but instead it rose. Being wrong in this business is not a crime, but it is vital to recognize the error as soon as possible and make a course correction, and if possible discern the reason or reasons for the error. Failure to do this through pride, obstinacy or stupidity can lead to modest losses becoming ruinous. So what happened?
Whilst recognizing that there are big differences between now and 2008, it still looked likely that gold would get dragged down with the stock market when it dropped hard due to a flight into cash driving the dollar up but so far at least, this has not happened. Also it was thought that a Head-and-Shoulders bottom was forming in the dollar, but on further consideration, the pattern looks too tilted to be valid, and it now looks instead like it is starting to break down from a bearish Rising Wedge whose point of origin was back in March-April of this year (see dollar index chart lower down the page).
The biggest difference between now and 2008 is that back then money flooded into the dollar in order to buy Treasuries, but this time round that does not appear to be happening, and it is not hard to see why. The last 10 years since that financial crisis can fairly be likened to a wild party aboard the Titanic, with the global economy stumbling forward in a zombiefied state, powered by QE and ZIRP, which incidentally provided the opportunity for the elites to drain the wealth of the lower and middle classes into their coffers. The result of all this is that U.S. debt has now expanded further to frightening and ruinous levels and the combination of this and the blatant attempt by the U.S. to control the entire world via its dollar reserve currency system through a combination of sanctions, crude military threats and now tariffs is causing attitudes to harden so that other countries are less and less prepared to pony up and support the U.S. by swapping goods and services for piles of intrinsically worthless paper in the form of dollars electronically created and then recycled into Treasuries.
Those who have been paying attention will know that other major powers like China and Russia have been preparing to dump the dollar for a long time now, by buying gold as fast as the West will sell it to them, devising their own payments systems to replace the SWIFT system and making bilateral trade agreements, etc. They also know that unless they have the military power to defend themselves, they would at some point be subject to military aggression by the U.S. if they try to cease using the dollar, hence their major effort to beef up their defensive capabilities.
Thus, what we are seeing is an intensifying buyers strike with respect to Treasuries that will continue to hike interest rates until the economy implodes, a process which has already started. When this happens, and it doesn't look far off, they will reach for their drug of choice, QE, which will then collapse the dollar leading quickly to hyperinflation. The extent to which the U.S. economy has been looted and plundered by the ruling elites for decades now is not fully understood by the American masses; if they did understand they would be marching on Washington. They have siphoned off countless trillions into the military-industrial complex, waged costly and destructive wars and invasions across the world, poured money into Israel, sickened and weakened the general population with food adulterated with countless additives and genetically modified food, and then made even more money out of them by peddling them overpriced drugs and medical care, destroyed the public transport system and created sprawling suburbs to increase the profits of oil companies as you have to drive two or three times as far to get anywhere as in Europe, killing town center communities and replacing them with shopping malls, bled families white to pay for useless production line college degrees, etc. It's no wonder there are so many crazies aroundand that's before the economy caves in.
All of this has racked up towering debts of astronomic proportions which they expect foreign jackasses to support by adhering to the dollar reserve currency system and accumulating intrinsically worthless IOUs in the form of Treasuries. The trouble is that foreigners have been starting to wake up to the fact that they have had a sign hanging round their necks for decades saying "Idiot" and one on their backs saying "Kick me," and have been actively planning to extricate themselves from this situation for some years now, by taking the steps set out in the paragraph above, which include building up gold reserves. So they are steadily withdrawing from supporting the Treasury market, which is going to leave the U.S. with a massive problem as the economy contracts, interest rates rise, the debt towers even higher, and the foreigners who have always been relied upon to support the whole mess fail to step up to the plate. So it's not hard to see why the dollar is set to plummet before too much longer, even if it gets some temporary relief from the stock market crashing and the chaotic Eurozone imploding.
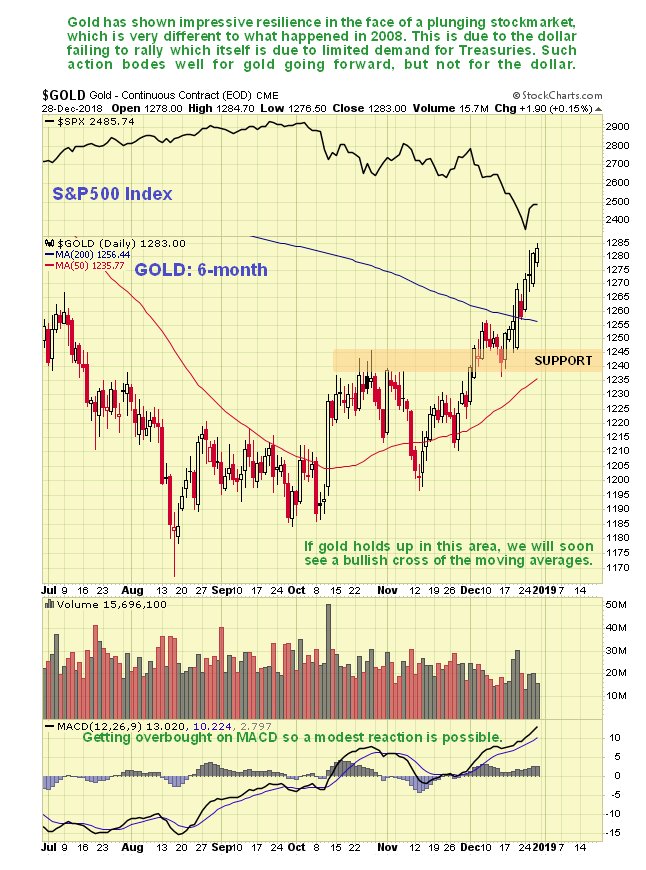
Thus, the fact that the dollar failed to rally either on the severe drop in the stock market of recent weeks or on the latest rate hike is viewed as an ominous development, both for the dollar itself and for the economy. This is what gold is picking up on and is the reason why it is has started to move ahead over the past couple of weeks.
Now we will quickly review the charts, starting with the 6-month chart for gold, on which we see that gold's advance over the past couple of weeks, although modest and measured, is certainly impressive given how the stock market has plunged during this period.
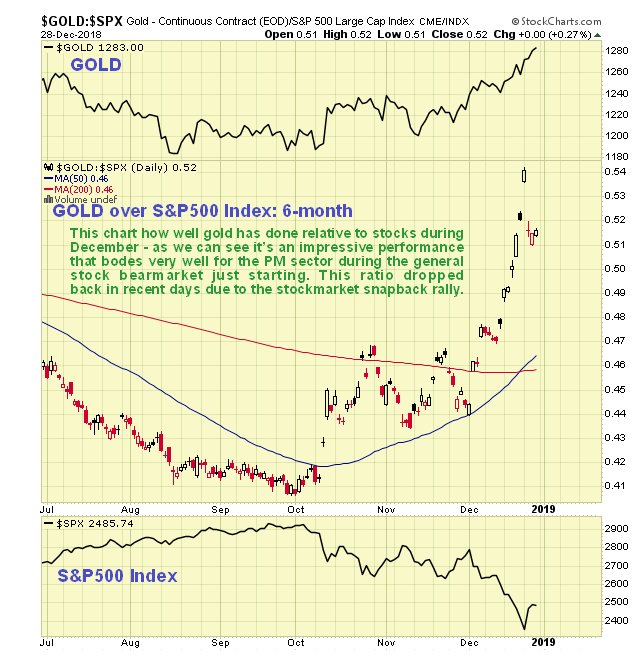
Just how impressive this move by gold has been is made plain by the chart for gold for the same time period plotted against the U.S. S&P 500 index. This shows an undeniably impressive performance by gold and reveals its newly acquired intrinsic strength. Notice how this ratio goes up when the stock market drops, and when the stock market rebounded the other day, it dropped. This is exactly what investors in the precious metals sector want to see and is the exact opposite of what happened in 2008.
Note that the latest COTs are not included in this update because they have been delayed by the Christmas holidays, and will become available early this week.
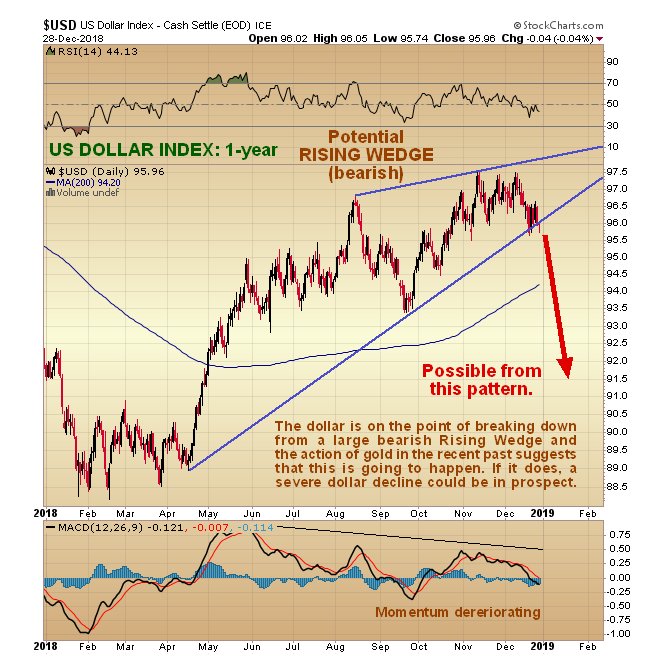
The key factor in all this is the dollar. Gold dropped in 2008 mainly because the dollar rallied sharply, but as we have witnessed in recent weeks this doesn't seem to be happening this time, for reasons that we have just considered. In the last update we looked at a bullish scenario for the dollar, which now seems to be off the table, and we later looked at a bearish scenario for the dollar on the site, which we will now review on the year-to-date chart for the dollar index below. This chart shows that the dollar is struggling here and on the point of breaking down from a bearish Rising Wedge. If this happens it is going to drop hard, in which case gold and silver are going advance strongly. Gold's rally of the past couple of weeks seems to be anticipating this and last week silver threw its hat into the ring, breaking out from a Double Bottom base and confirming gold's recent strength.
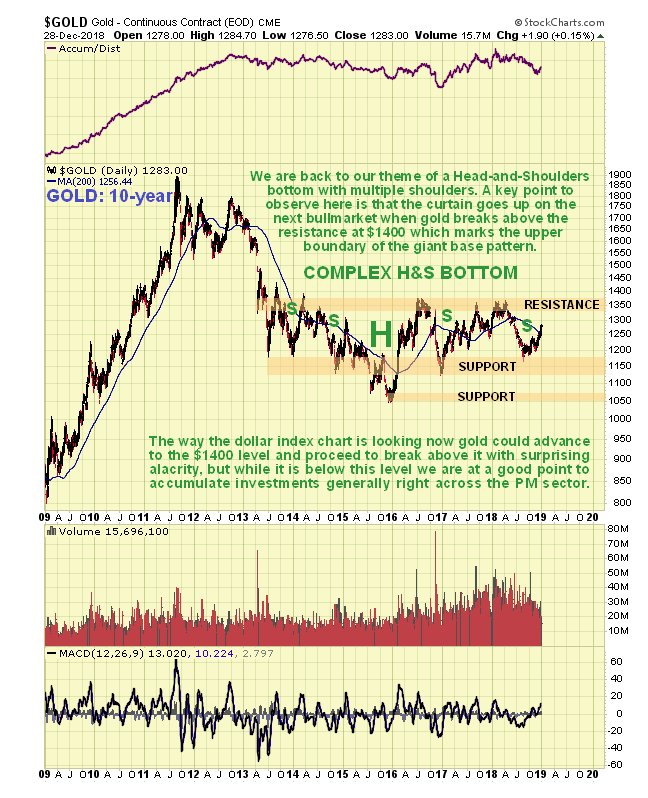
While we were wrong in the last update, the good news is that we haven't actually missed all that much, for as we can see on gold's latest 10-year chart, this party hasn't even started yet, and it won't, officially speaking, until gold breaks above the clear line of heavy resistance at $1,400 that marks the upper boundary of its giant potential multiple Head-and-Shoulders bottom. While that level is still some way above the current price, it could get there PDQ (pretty damn quick) if the dollar breaks down from its Rising Wedge and drops hard soon, as is looking increasingly likely, and follow through with a breakout into a vigorous bull market that will dwarf the one of the 2000s into 2011.
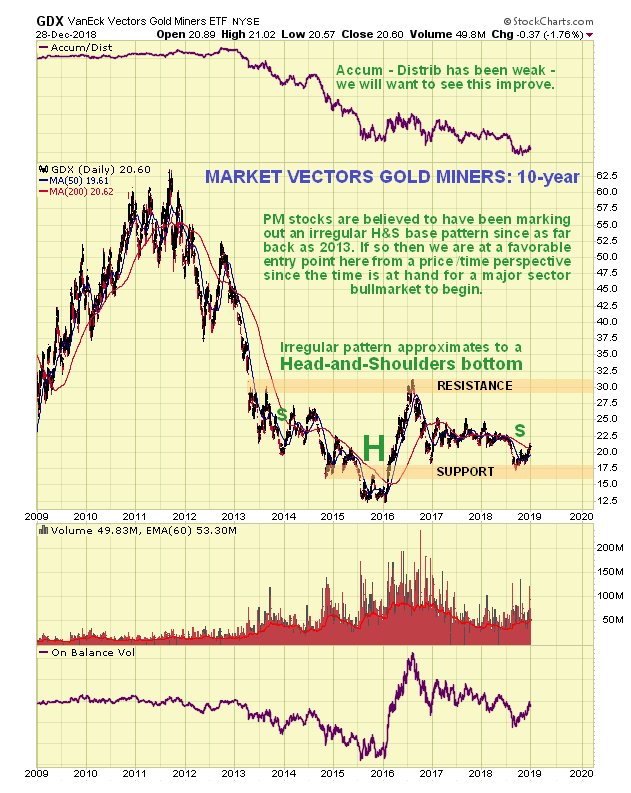
Likewise, the rally so far in the precious metals sector has been minuscule compared to what's coming if gold breaks out above $1,400, as we can on the 10-year chart for the GDX, where we can see a sort of rough-hewn Head-and-Shoulders bottom. If this is what it turns out to be then we still have great prices for most stocks in the sector, as it is still very close to what should turn out to be the Right Shoulder low of a giant Head-and-Shoulders bottom.
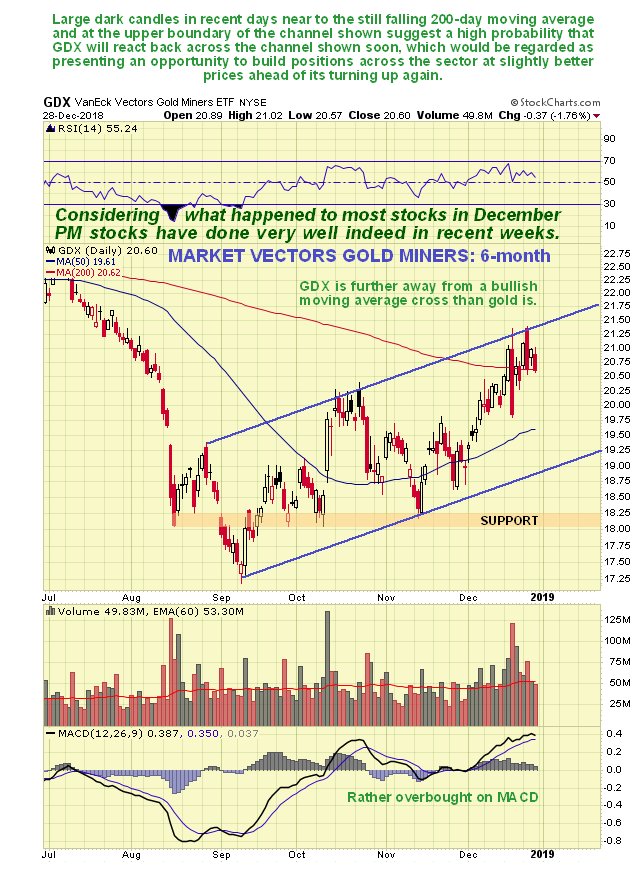
The 6-month chart for GDX is interesting as it shows that a pitched battle between bulls and bears is occurring in the vicinity of its still falling 200-day moving average and at the upper boundary of the channel shown. While the larger dark candles and higher volume suggest that the bears will temporarily win the day and force a reaction, this would accord with gold backing off a bit as the stock market advances a little further before reversing, and any such reaction should present a good buying opportunity. Another significant upleg will soon result in a bullish cross of the moving averages.
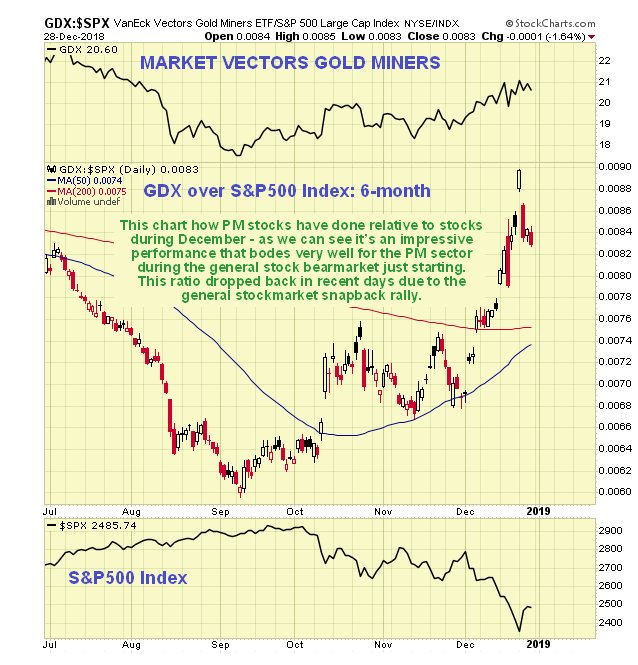
The impressive outperformance by precious metals stocks relative to general stocks during the past few weeks is amply illustrated by the 6-month ratio chart for the GDX relative to the S&P 500 index. This ratio eased back in recent days due to the stock market's snapback rally.
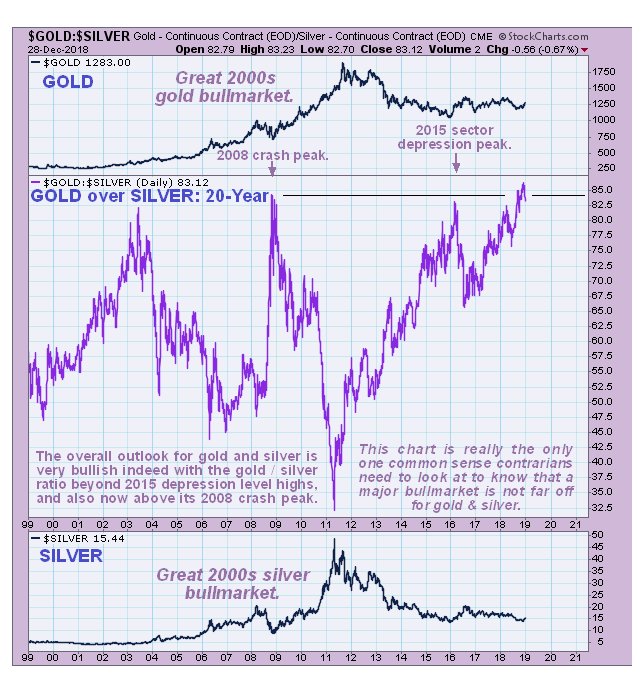
We are going to wind up by looking at two charts that ought to turn even the dourest of skeptics into precious metals sector bulls. First, the chart for the gold to silver ratio, which shows that it is at levels that have only been reached on three occasions in the past 20 years. The first occasion was in 2002, when the great 2000s sector bull market was in its early stages. The second was at the depths of the 2008 crash, which also dragged down the PM sector due to the dollar spiking, which doesn't look it is going to happen this time round, or if it does it is likely to be much more muted. The third occasion was at the trough of the sector depression late in 2015 and early in 2016, when PM stocks were crazy cheap. The ratio exceeded all this levels in the recent past, which is a reliable sign that a major new bull market is not far away.
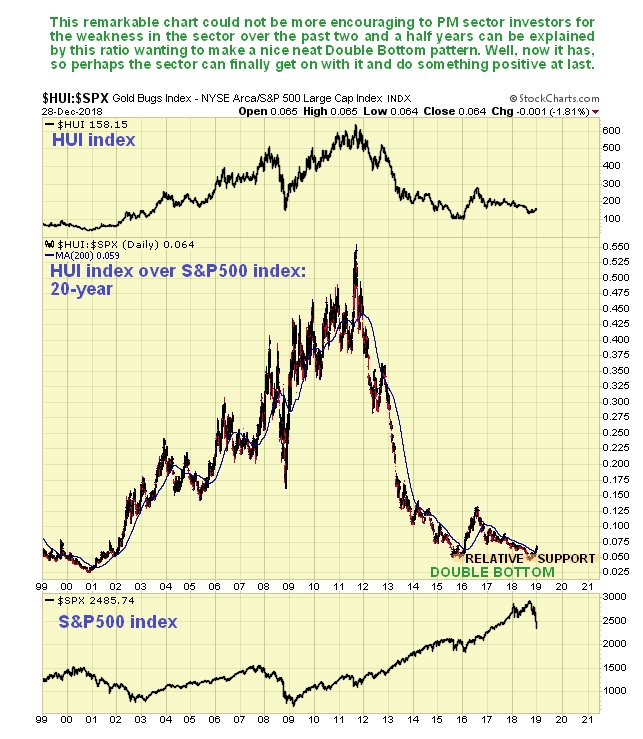
Next and last we will take a look at the 20-year chart for the ratio of the HUI goldbugs index to the S&P 500 index. This ratio chart provides a technical explanation for why the sector was so weak over the past 2 and a half yearsit wanted to make a nice neat Double Bottom with its lows of late 2015, and now that it has done so and is starting to rise up again, it would appear that it is satisfied. This is a chart that bodes very well indeed for the sector, especially as the rise off the second low of the Double Bottom occurred as the broad stock market was falling heavily.
This update started out by me admitting I was wrong by being too bearish on gold and silver in the last update, but in fairness to myself, I was right about a lot of things. Like the stock market caving in, in particular the FAANG stocks. Thus, we made a lot of money out of Apple Puts, and by buying a range of broad market inverse ETFs, which we sold for a nice profit before and after Christmas.
Let's end on a positive note by saying that if you thought 2018 was bad, wait until you see what a terrible year 2019 will turn out to be. By "positive note" we mean that although most investors will end up losing a lot of money in 2019, it won't include us and doesn't have to include you. On a general level, if you buy the precious metals sector here or soon, and dump most everything else, you should come out on top by the end of the next year, and handsomely so in many cases. Of course, on the site we try to be rather more specific than that and will detail the various large cap, mid cap and small cap mining stocks and also ETFs that can be used to this end.
So Happy New Year to you all, and as for 2019bring it on!!
Clive Maund has been president of www.clivemaund.com, a successful resource sector website, since its inception in 2003. He has 30 years' experience in technical analysis and has worked for banks, commodity brokers and stockbrokers in the City of London. He holds a Diploma in Technical Analysis from the UK Society of Technical Analysts.
[NLINSERT]Disclosure:
1) Statements and opinions expressed are the opinions of Clive Maund and not of Streetwise Reports or its officers. Clive Maund is wholly responsible for the validity of the statements. Streetwise Reports was not involved in the content preparation. Clive Maund was not paid by Streetwise Reports LLC for this article. Streetwise Reports was not paid by the author to publish or syndicate this article.
2) This article does not constitute investment advice. Each reader is encouraged to consult with his or her individual financial professional and any action a reader takes as a result of information presented here is his or her own responsibility. By opening this page, each reader accepts and agrees to Streetwise Reports' terms of use and full legal disclaimer. This article is not a solicitation for investment. Streetwise Reports does not render general or specific investment advice and the information on Streetwise Reports should not be considered a recommendation to buy or sell any security. Streetwise Reports does not endorse or recommend the business, products, services or securities of any company mentioned on Streetwise Reports.
3) From time to time, Streetwise Reports LLC and its directors, officers, employees or members of their families, as well as persons interviewed for articles and interviews on the site, may have a long or short position in securities mentioned. Directors, officers, employees or members of their immediate families are prohibited from making purchases and/or sales of those securities in the open market or otherwise from the time of the interview or the decision to write an article until three business days after the publication of the interview or article. The foregoing prohibition does not apply to articles that in substance only restate previously published company releases.
Charts provided by the author.
CliveMaund.com Disclosure:
The above represents the opinion and analysis of Mr Maund, based on data available to him, at the time of writing. Mr. Maund's opinions are his own, and are not a recommendation or an offer to buy or sell securities. Mr. Maund is an independent analyst who receives no compensation of any kind from any groups, individuals or corporations mentioned in his reports. As trading and investing in any financial markets may involve serious risk of loss, Mr. Maund recommends that you consult with a qualified investment advisor, one licensed by appropriate regulatory agencies in your legal jurisdiction and do your own due diligence and research when making any kind of a transaction with financial ramifications. Although a qualified and experienced stock market analyst, Clive Maund is not a Registered Securities Advisor. Therefore Mr. Maund's opinions on the market and stocks can only be construed as a solicitation to buy and sell securities when they are subject to the prior approval and endorsement of a Registered Securities Advisor operating in accordance with the appropriate regulations in your area of jurisdiction.


