

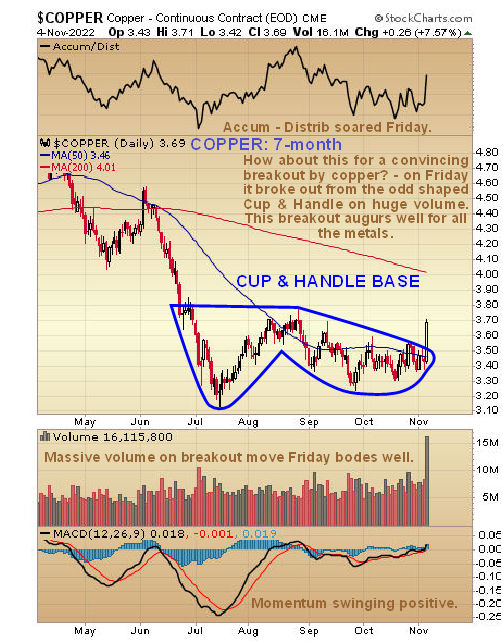
Further to our observation in the last gold market update that copper has just broken out of a multi-month Cup & Handle base, the logical next step is to put this knowledge to practical use by figuring out which copper stocks look set to benefit from the expected higher copper prices.
Ae will start today by looking at one of the really big ones that are a prime candidate as a core holding of a metals’ stock portfolio, and that looks set to do well.
This is Lundin Mining Corp. (LUN:TSX).
The first point to make is that would-be investors should not be put off by the seemingly large number of shares in issue at 770 million because Lundin is a big company with an impressive portfolio of properties in a wide array of countries, as we can see on the graphic below lifted off the company's website.
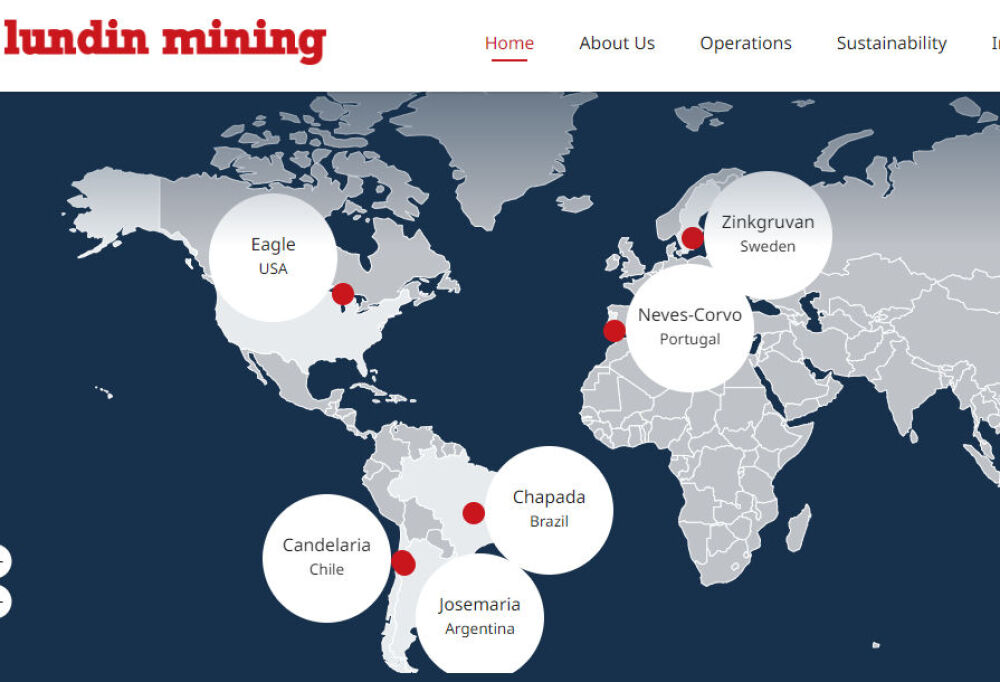
This means that when demand kicks in for this stock, it will be big because of its broad appeal, so the number of shares in the issue will not impede its progress.
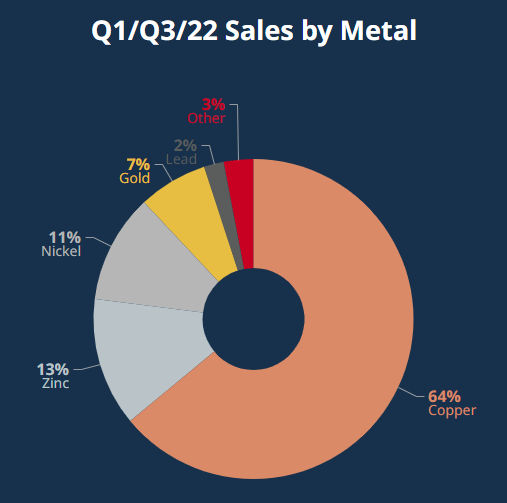
Next, we want to know what proportion of the company’s sales revenue comes from copper.
On the pie chart below, we can see that it is an impressive 64%, with a bonus being the useful 7% contribution from gold, which, as we know, is set to go much higher.
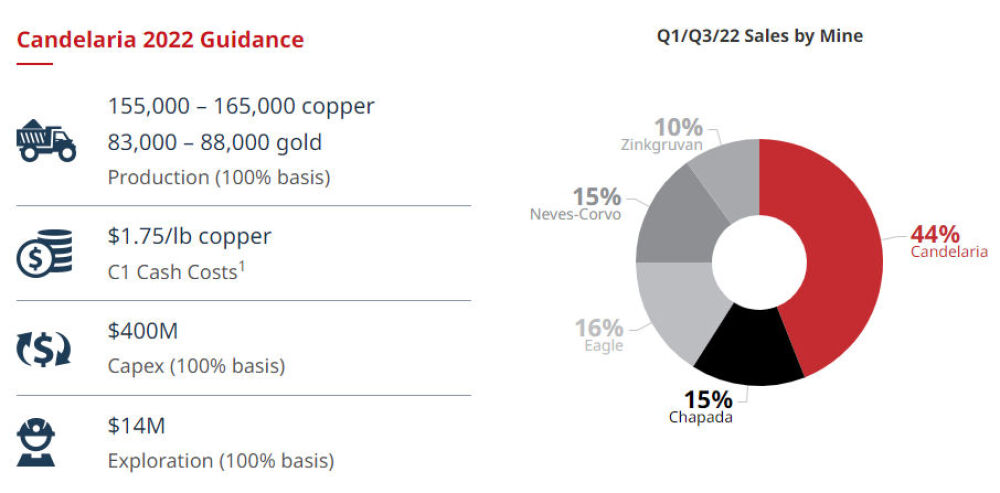
The company operates the massive Candelaria open pit near Copiapo in northern Chile, which is 80% owned by Lundin and 20% by the Japanese company Sumitomo.
This mine makes the biggest contribution to the company’s revenues by far, as we can see on the Sales by Mine pie chart shown below.
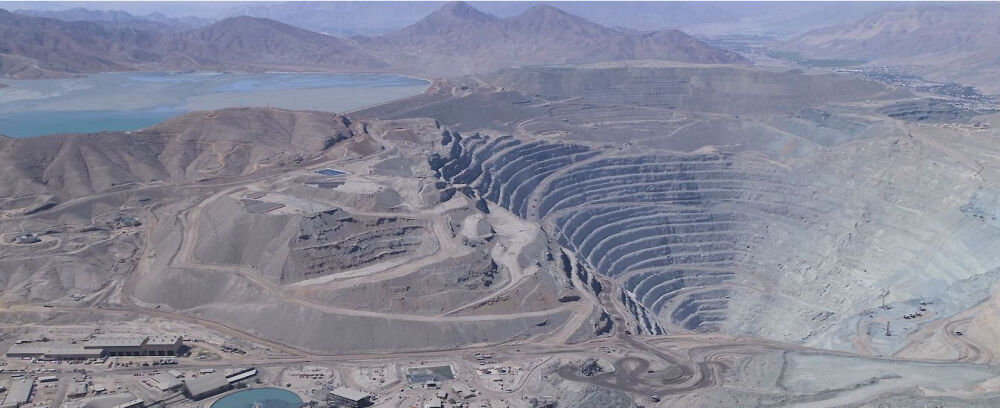
You will readily understand why the Candelaria open pit makes such a contribution to the company’s fortunes when you look at this aerial photo of it.
Now we will proceed to examine the charts for the company’s stock to see how it’s shaping up.
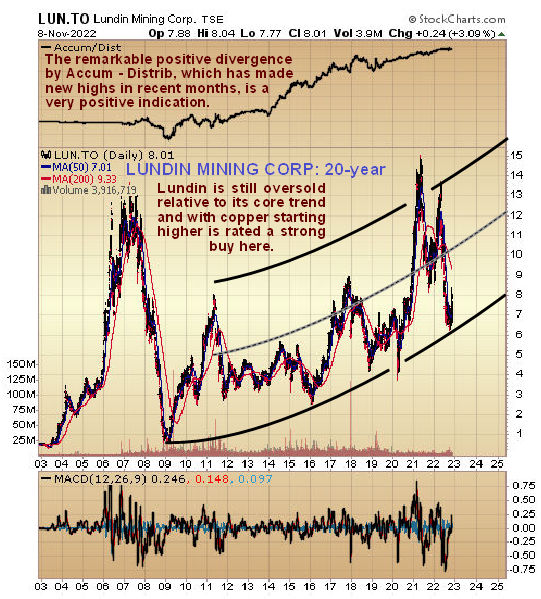
Starting with the long-term 20-year chart to get the big picture, we can see that the stock price is still considerably below the highs it attained way back in 2007 and also that it took it a long time to recover from the fallout resulting from the 2008 – 2009 general market crash which caused most resource stocks to plummet.
The main takeaway from this chart is that after a really big and impressive runup in 2020 and into 2021, it has reacted back heavily to become oversold at the lower boundary of the giant broad rather loosely defined parabolic uptrend channel shown from which it has just started to turn up in sympathy with copper.
Before leaving this chart, note the extraordinary strength of the Accumulation line shown at the top of it, which has made new highs in recent months despite the stock price dropping back from a peak at about CA$15 in 2021 to about CA$6.25 this past September.
This certainly has bullish implications.
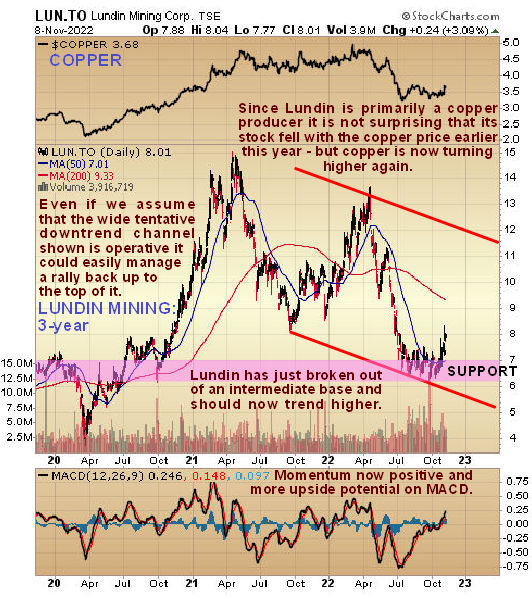
Zooming out via the 3-year chart, we can see how the price has zig-zagged lower within a wide downtrend channel from its 2021 peak, with this downtrend being comprised of two big downlegs punctuated by a large countertrend rally.
While the downtrend in the broad stock market this year clearly didn’t help, we can see that the primary driver for the second big downleg during this period was the drop in the copper price.
The chart for copper is shown at the top of this chart.
After marking out an intermediate base pattern at support and at the tentative lower rail of the broad channel shown in recent months, the price has broken higher to start a new uptrend, which at a minimum, should take it back up to the upper rail of the channel, currently a little above CA$12 and in favorable conditions it should go much higher.
Now we will review recent action in more detail on the year-to-date chart on which we see that the intermediate base pattern that has formed from about July has taken the form of a clearly defined Cup.
Not surprisingly, it broke out of this Cup base last Friday at the same time that copper broke out of its Cup & Handle base, and the 7-month chart for copper that was included in the last Gold Market update shows copper’s high volume breakout is placed below for comparison.
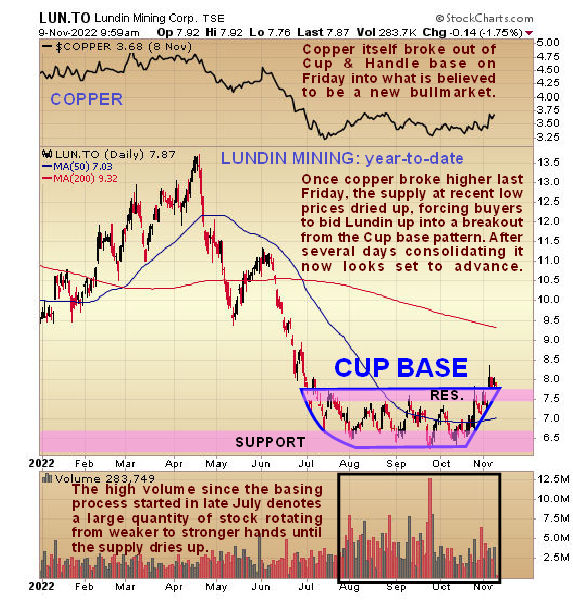
Right now, Lundin appears to be consolidating last Friday’s gap breakout move with a tiny bull Flag forming on declining volume, which is expected to be followed by renewed advance, so this looks like a very good time to buy with it easing back on lighter volume to close the gap at the time of writing.
Finally, for those of you laboring under the illusion that the mining industry is a last bastion of maleness, I take this opportunity to present you with a photo that will make it clear to you that it’s over.
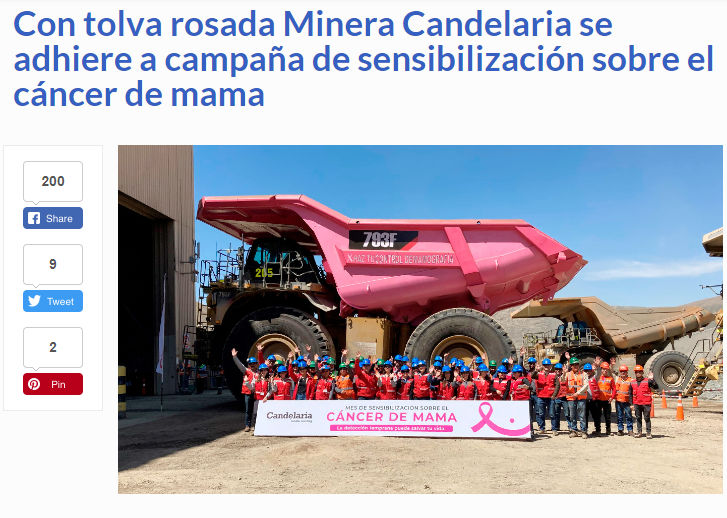
Move aside, guys — the pink trucks are rolling!
Conclusion: Lundin Mining is a core copper stock holding that is rated a strong Buy here for all timeframes. Lundin trades in healthy volumes on the US OTC market.
Lundin Mining's website.
Lundin Mining Corp. closed for trading at CA$7.68, $5.73 at 1.20 pm EST on November 9, 2022.
Want to be the first to know about interesting Critical Metals and Base Metals investment ideas? Sign up to receive the FREE Streetwise Reports' newsletter.
Subscribe
CliveMaund.com Disclosures
The above represents the opinion and analysis of Mr. Maund, based on data available to him, at the time of writing. Mr. Maund's opinions are his own, and are not a recommendation or an offer to buy or sell securities. Mr. Maund is an independent analyst who receives no compensation of any kind from any groups, individuals or corporations mentioned in his reports. As trading and investing in any financial markets may involve serious risk of loss, Mr. Maund recommends that you consult with a qualified investment advisor, one licensed by appropriate regulatory agencies in your legal jurisdiction and do your own due diligence and research when making any kind of a transaction with financial ramifications. Although a qualified and experienced stock market analyst, Clive Maund is not a Registered Securities Advisor. Therefore Mr. Maund's opinions on the market and stocks can only be construed as a solicitation to buy and sell securities when they are subject to the prior approval and endorsement of a Registered Securities Advisor operating in accordance with the appropriate regulations in your area of jurisdiction.
Disclosures:
1) Clive Maund: I, or members of my immediate household or family, own securities of the following companies mentioned in this article: None. I personally am, or members of my immediate household or family are, paid by the following companies mentioned in this article: None.
2) The following companies mentioned in this article are billboard sponsors of Streetwise Reports: None. Click here for important disclosures about sponsor fees. As of the date of this article, an affiliate of Streetwise Reports has a consulting relationship with None. Please click here for more information.
3) Statements and opinions expressed are the opinions of the author and not of Streetwise Reports or its officers. The author is wholly responsible for the validity of the statements. The author was not paid by Streetwise Reports for this article. Streetwise Reports was not paid by the author to publish or syndicate this article. Streetwise Reports requires contributing authors to disclose any shareholdings in, or economic relationships with, companies that they write about. Streetwise Reports relies upon the authors to accurately provide this information and Streetwise Reports has no means of verifying its accuracy.
4) This article does not constitute investment advice. Each reader is encouraged to consult with his or her individual financial professional and any action a reader takes as a result of information presented here is his or her own responsibility. By opening this page, each reader accepts and agrees to Streetwise Reports' terms of use and full legal disclaimer. This article is not a solicitation for investment. Streetwise Reports does not render general or specific investment advice and the information on Streetwise Reports should not be considered a recommendation to buy or sell any security. Streetwise Reports does not endorse or recommend the business, products, services or securities of any company mentioned on Streetwise Reports.
5) From time to time, Streetwise Reports LLC and its directors, officers, employees or members of their families, as well as persons interviewed for articles and interviews on the site, may have a long or short position in securities mentioned. Directors, officers, employees or members of their immediate families are prohibited from making purchases and/or sales of those securities in the open market or otherwise from the time of the decision to publish an article until three business days after the publication of the article. The foregoing prohibition does not apply to articles that in substance only restate previously published company releases.


