

In years to come, many investors will look back upon the past weeks and months as another great opportunity missed, to be added to the list that most of us keep or have in our heads of other great opportunities missed, but you, dear reader, do not have to be among them.
That great opportunity is the precious metals sector which now looks set to soar imminently.
With gold rising US$45 as the dollar index plunged by 1.8% after a long and grueling downtrend from last March through April, there is still everything to go for, as technically the sector has not broken out yet, so we still have excellent prices across the board.
This has already been brought to the attention of subscribers in the article of the 24th entitled Precious Metals Sector Update — It’s looking good, and the reminder article posted on the 30th last entitled Precious Metals Sector Believed To Be Close to Major Uptrend, which included an important 5-year chart for the dollar index showing its parabolic blowoff move and a link to an important and prescient article by Adam Hamilton entitled Gold Stocks’ Winter Rally 7 which makes a strong case for investing in the sector now.
The great news is that, with the starting gun for this major bull market only being fired last Friday, with gold rising US$45 as the dollar index plunged by 1.8% after a long and grueling downtrend from last March through April, there is still everything to go for, as technically the sector has not broken out yet, so we still have excellent prices across the board, but as we will see it looks like it is about to.
A crucial point to understand about the bull market that is believed to be imminent is that it is likely to be unprecedented in magnitude so that it ends up dwarfing both the 1970s bull market and the bull market into the 2011 highs, and the reasons for this are not hard to see — the collapse of the dollar and a rapid global descent into a hyperinflationary conflagration as governments attempt to keep things going as long as possible by the simple expedient of creating more and more money.
A catalyst for the commotion on Friday that saw the dollar tank and metals soar appears to have been the revelation by Nomi Prins that China and Russia Will Use Their Massive Gold Hoards To Form A New Currency, but the more probable explanation is that There Are Massive Record Breaking “Mystery Buyers” In Gold All Of A Sudden.
They have been building toward this for years, of course, and it is common knowledge that it will happen one day, but once they actually go ahead and do it, the dollar will be toast as it is immolated by the crushing worldwide dollar debt burdens.
This will quickly result in the global hegemon, the U.S., having its legs cut from under it, and it will then become a third-world country, and the days of fielding 800 military bases across the world and staging foreign military interventions will be over.
Foreknowledge of this looming impotency probably explains why they are forcing a war with Russia now in an effort to destroy it while they still can.
Now we will proceed to review the encouraging charts for the precious metals sector that are bolstered by the positive charts for copper and palladium, and even oil, which we will also look at later.
The Gold Market
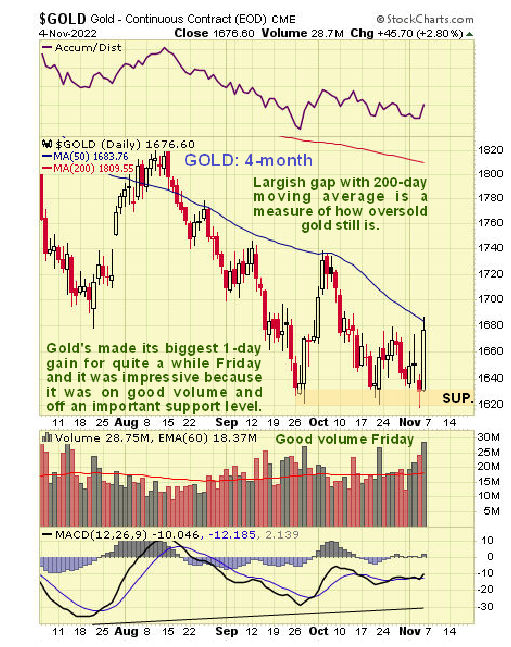
On gold’s latest 4-month chart, we can see the big move up on Friday which occurred after the third test of what is now clearly an important support level at US$1620.
This is a great point to buy gold and silver stocks.
Whilst we are aware that this move did not break the gold price above the resistance at US$1680 or above its falling 50-day moving average, the magnitude of the gain and the high volume driving it are certainly a bullish indication, especially if we factor in how the dollar got clobbered on Friday and how copper made a rather spectacular high volume breakout and other developments such as oil also breaking out, all of which we will come to a little later.
So it looks like gold is turning here, in which case last week was your last opportunity to buy it very close to recent lows.
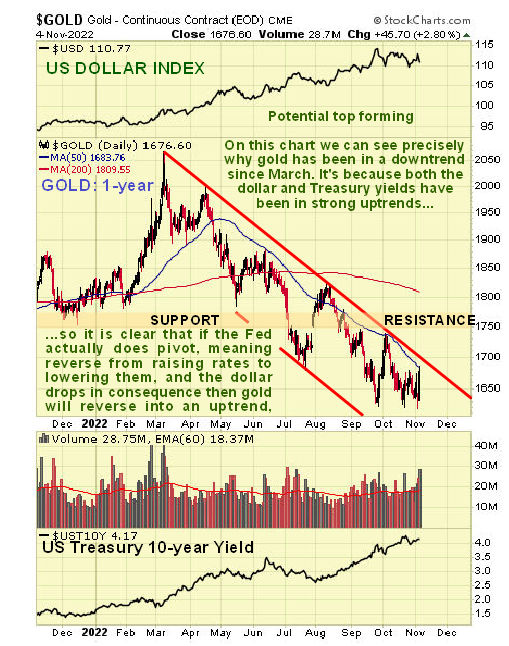
Zooming out by using a 1-year chart, we can see the entirety of gold’s downtrend from its March highs which it has yet to break out of.
Whilst gold’s decline during this period is a source of puzzlement to some in view of inflation ramping up, we can see immediately on this chart what caused it — the rising dollar and rising interest rates shown at the top and bottom of the chart.
Gold has been like a beach ball pushed under water during this period — it wants to go up and definitely will if either the Fed reverses its trend of raising rates which will remove support from the dollar, or if other countries and trading blocs decide that what’s good enough for the Fed is good enough for them and they start raising rates rapidly too, in which case U.S. assets will lose their appeal.
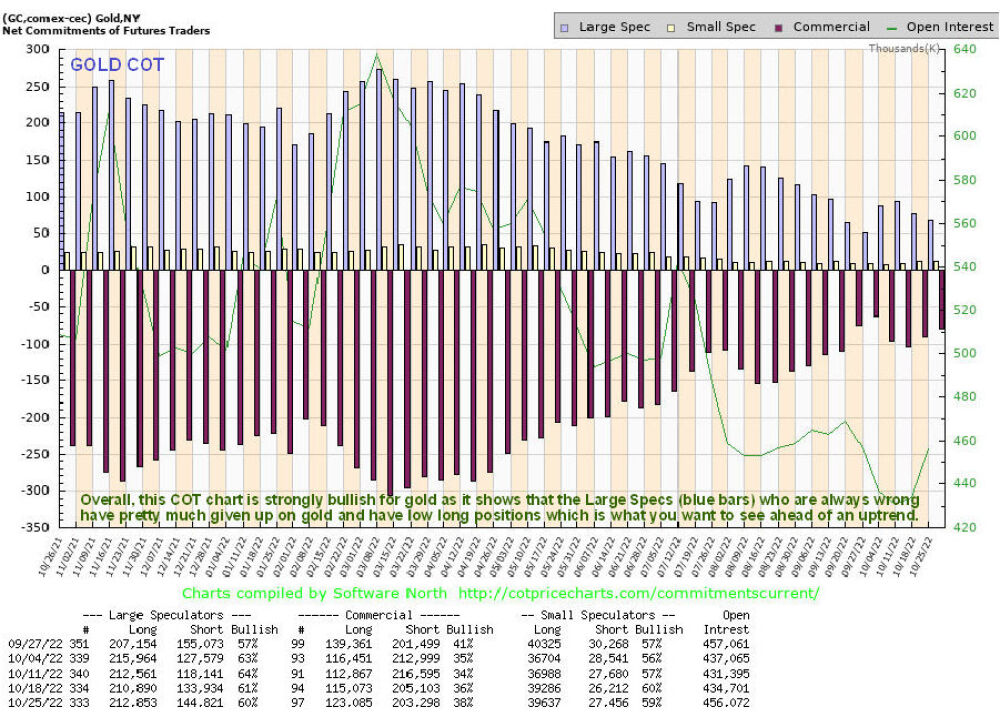
Gold’s COT chart is certainly conducive to a major rally, for as we can see on it, the Large Specs have little enthusiasm for it now, which is what we want to see as collectively they are always wrong — the current low Large Spec long positions are a strongly bullish indication.
What about gold and silver stocks?
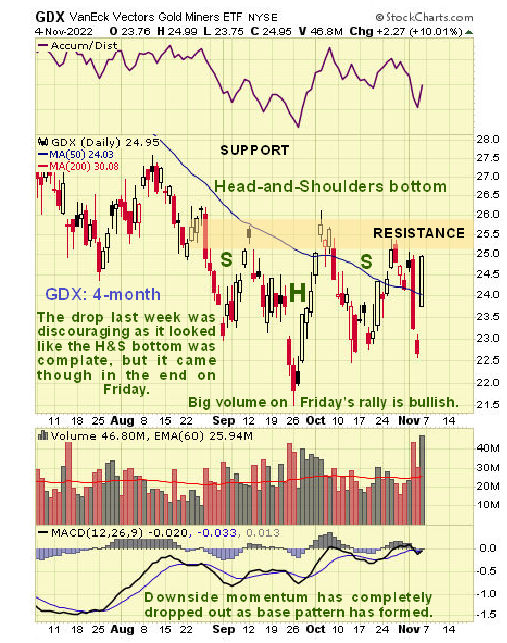
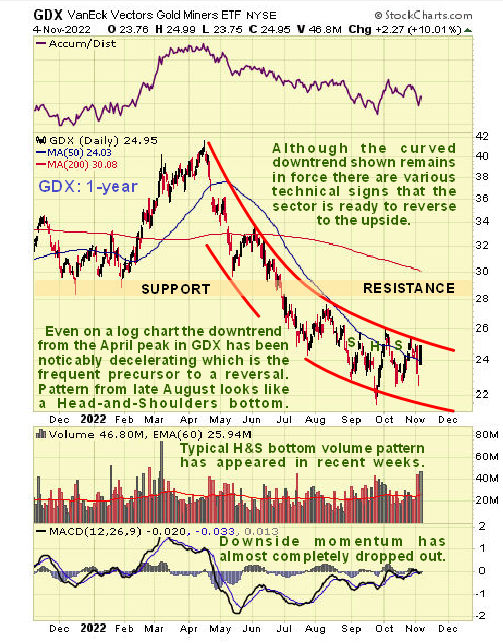
In a nutshell, this is a great point to buy them. On the latest 4-month chart for GDX, we can see the disconcerting sharp drop on Wednesday and Thursday because it had looked like the Head-and-Shoulders bottom that we had earlier delineated was complete, but it came through in the end with the big gain on Friday.
However, it still hasn’t broken out above the resistance at the top of the pattern, but the high volume driving Friday’s rise and the improvement in momentum (MACD) suggest that it won’t be long before it does break out.
The 1-year chart for GDX makes very clear why this is a great point at which to buy gold and silver stocks, for, on it, we see that after being stuck in a decelerating downtrend from its April highs which at its low point cut its price almost in half, GDX appears to be completing a Head-and-Shoulders bottom within this channel that has been accompanied by a volume pattern typical of such a base pattern.
So it doesn’t look like it will be long until it breaks out of both the H&S bottom and the curved channel, and when it does, it is likely to advance smartly, especially if the dollar tanks at the same time, and as we will shortly proceed to see, that could very well happen.
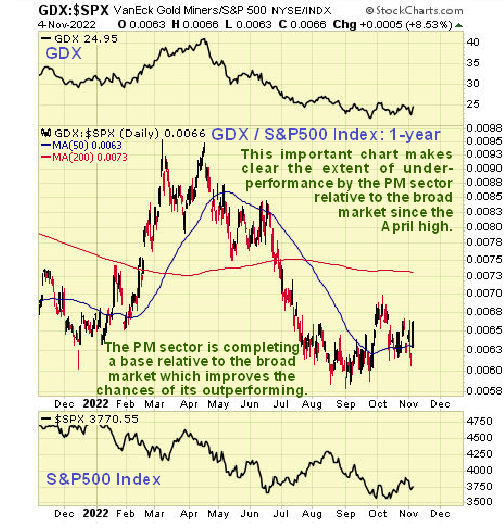
In the context of the foregoing, it’s useful for us to consider the extent to which the PM sector has markedly underperformed even the frail stock market in recent months.
On the 1-year chart for GDX over the S&P500 index, we can see that it has seriously underperformed due to the strong rise in the dollar and interest rates.
This is important because it means that the PM sector has even better value here than the broad market.
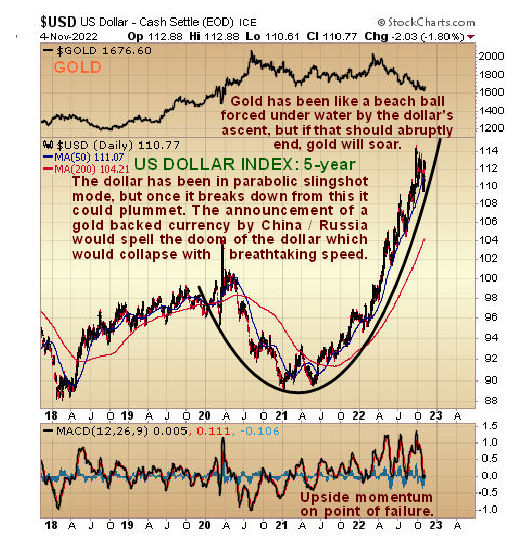
On its latest 5-year chart, we can see that having gone parabolic in recent months, the dollar index is out on the proverbial limb. Things could get ugly fast for the dollar if it breaks down from this accelerating uptrend which looks like it is becoming impossibly steep.
The catalyst for such a breakdown could be the spreading realization across markets that China and Russia or the BRICS countries are about to launch a gold-backed currency. As mentioned above, China and Russia have been hoarding gold for years, presumably with an eye to doing exactly that, and the latest bullying by the hegemon with respect to Taiwan and Ukraine may be “the last straw” that pushes them into doing it.
When they do, the shockwaves will reverberate around the world as the dollar, suddenly stripped of its reserve currency status, goes into freefall. It looks like this is what gold and silver are now, at last, just starting to anticipate.
The U.S. Dollar
The dollar is perilously close to breaking down from this parabolic slingshot uptrend with upside momentum on the point of failing.
Even though gold and silver did not themselves break out on Friday, some commodities did, so we will end this by taking a quick look at a couple of their charts and the chart for the commodity index since they are supportive of gold and silver breakouts soon.
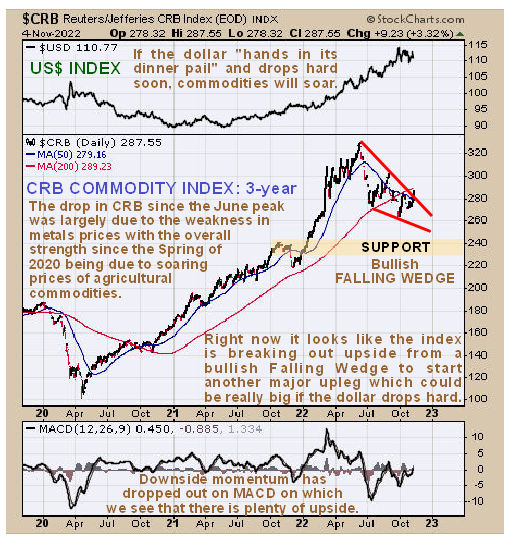
When we look at the chart for the CRB commodity index, we should do so with the knowledge that this index includes a load of softs, i.e., agricultural commodities that have been doing very well of late due to the looming food crisis.
So although this index has fallen from its June peak, as we can see on its latest 3-year chart below, which is believed to be largely due to this year’s weakness in metals prices, it is overall strong thanks to the upward march of agricultural commodities prices.
Right now, it looks like it is about to break out upside from the bullish Falling Wedge that has formed from the June peak, as metals prices start higher again after the recent dollar and interest rate-induced correction.
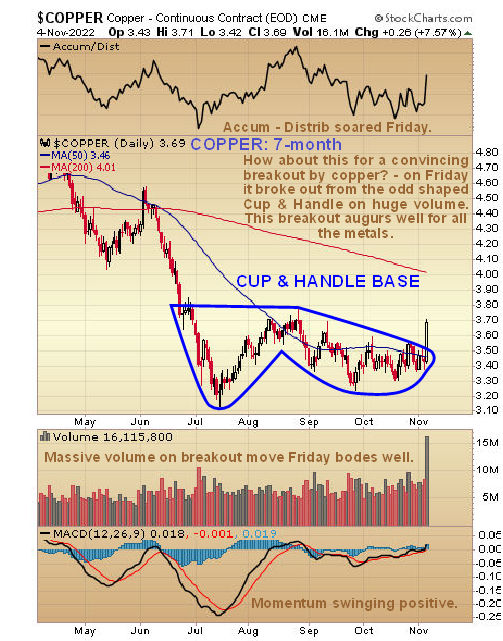
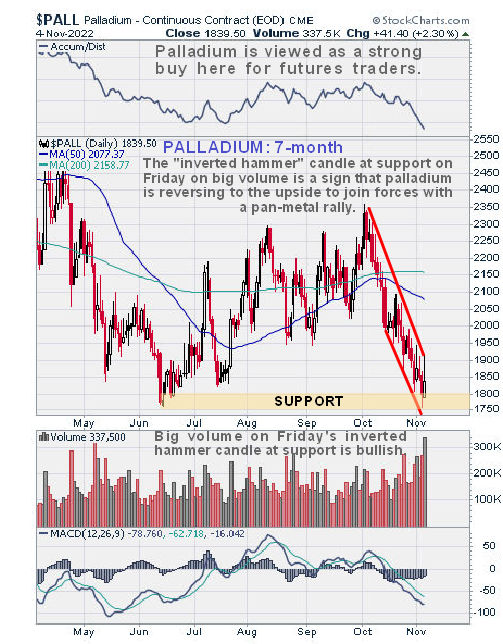
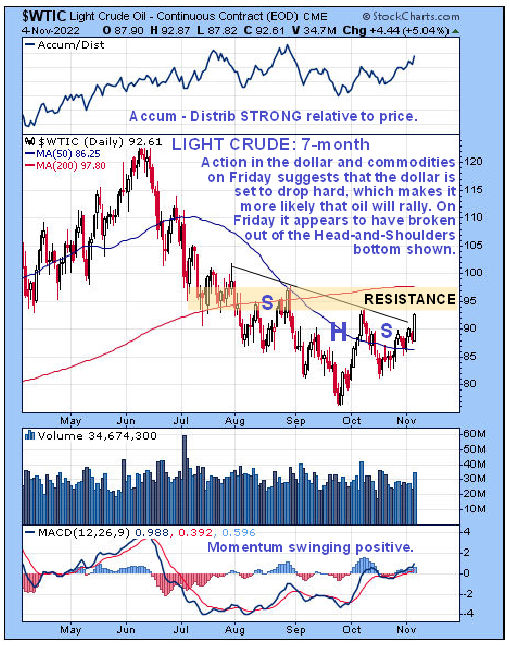
Copper, Palladium, and Oil
Copper staged a particularly spectacular breakout on Friday on a very big volume from a rather odd-shaped Cup & Handle base, which certainly bodes well for precious metals prices.
So the shares of copper producers should do well going forward.
Meanwhile, Palladium, which has been in a steep downtrend over the past month, put in a bullish “inverted hammer” candle on big volume at the support at its June lows on Friday, suggesting that it is reversing to the upside.
Oil’s performance was also impressive on Friday, with Light Crude rising almost US$4.50 to break out above the neckline of a downsloping Head-and-Shoulders bottom, as we can see on its 7-month chart below.
Obviously, a falling dollar will eliminate this source of headwinds to a rising oil price . . .
What about the risk of a stock market crash and the collateral damage it would be expected to inflict on commodity prices?
The latest moves we are seeing in the dollar and in commodity prices are an indication that, by its actions, the Fed prefers the prospect of hyperinflation to that of a deflationary implosion, which implies that it will keep creating more and more money to stave off the latter, which further implies robust inflation trending in the direction of hyperinflation and strongly rising commodity prices.
| Want to be the first to know about interesting Gold, Critical Metals, Base Metals, Silver and Oil & Gas - Exploration & Production investment ideas? Sign up to receive the FREE Streetwise Reports' newsletter. | Subscribe |
CliveMaund.com Disclosures
The above represents the opinion and analysis of Mr. Maund, based on data available to him, at the time of writing. Mr. Maund's opinions are his own, and are not a recommendation or an offer to buy or sell securities. Mr. Maund is an independent analyst who receives no compensation of any kind from any groups, individuals or corporations mentioned in his reports. As trading and investing in any financial markets may involve serious risk of loss, Mr. Maund recommends that you consult with a qualified investment advisor, one licensed by appropriate regulatory agencies in your legal jurisdiction and do your own due diligence and research when making any kind of a transaction with financial ramifications. Although a qualified and experienced stock market analyst, Clive Maund is not a Registered Securities Advisor. Therefore Mr. Maund's opinions on the market and stocks can only be construed as a solicitation to buy and sell securities when they are subject to the prior approval and endorsement of a Registered Securities Advisor operating in accordance with the appropriate regulations in your area of jurisdiction.
Disclosures:
1) Statements and opinions expressed are the opinions of Clive Maund and not of Streetwise Reports or its officers. The author is wholly responsible for the validity of the statements. Streetwise Reports was not involved in any aspect of the article preparation. The author was not paid by Streetwise Reports LLC for this article. Streetwise Reports was not paid by the author to publish or syndicate this article.
2) This article does not constitute investment advice. Each reader is encouraged to consult with his or her individual financial professional and any action a reader takes as a result of information presented here is his or her own responsibility. By opening this page, each reader accepts and agrees to Streetwise Reports' terms of use and full legal disclaimer. This article is not a solicitation for investment. Streetwise Reports does not render general or specific investment advice and the information on Streetwise Reports should not be considered a recommendation to buy or sell any security. Streetwise Reports does not endorse or recommend the business, products, services or securities of any company mentioned on Streetwise Reports.
3) From time to time, Streetwise Reports LLC and its directors, officers, employees or members of their families, as well as persons interviewed for articles and interviews on the site, may have a long or short position in securities mentioned. Directors, officers, employees or members of their immediate families are prohibited from making purchases and/or sales of those securities in the open market or otherwise from the time of the decision to publish an article until three business days after the publication of the article. The foregoing prohibition does not apply to articles that in substance only restate previously published company releases.


