

Abitibi Metals is looking very attractive here for several important reasons. The first is that last Fall it moved to acquire an 80% interest in the B26 Polymetallic deposit in Quebec that holds 400 million pounds of copper and that’s a 2018 estimate plus significant quantities of other metals. The next related reason is that, with a massive copper supply shortfall bearing down on the market that cannot easily be fixed, copper prices are set to accelerate higher in a powerful bull market and lastly the reaction in the stock price of recent months has cut the share price in half from its late February peak.
Before turning our attention to the stock charts we will overview the fundamentals of the company in a succinct manner with reference to its <A HREF="https://abitibimetals.com/wp-content/uploads/2024/05/AMQ-Investor-Presentation-Q2-2024.pdf">latest Investor Deck</A>.
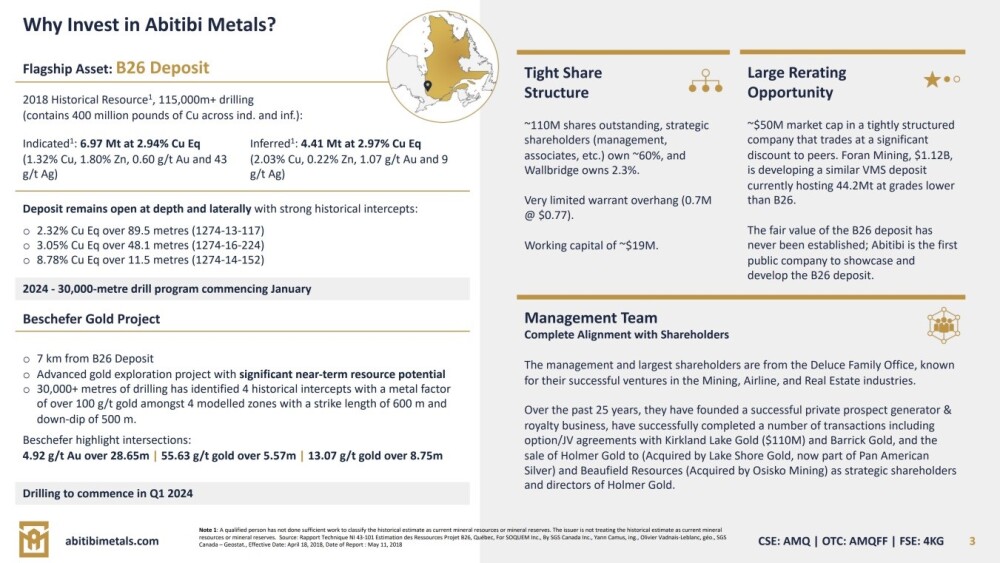
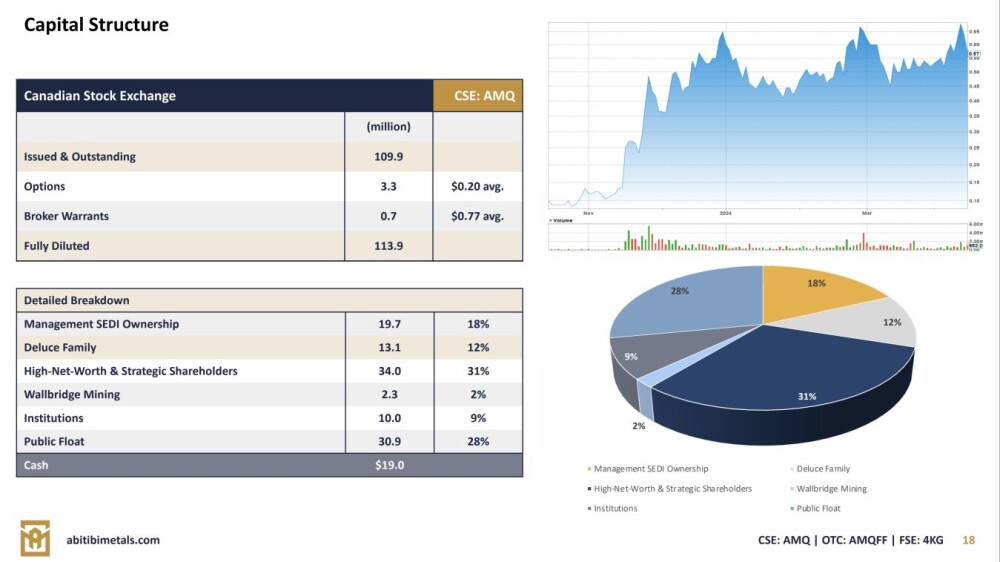
Our 1st slide gives some important general information about the company. Note in particular that less than only 31% of the company’s stock is in the float and that it trades at a significant discount to peers with a lot of scope for revaluation of the company’s projects.
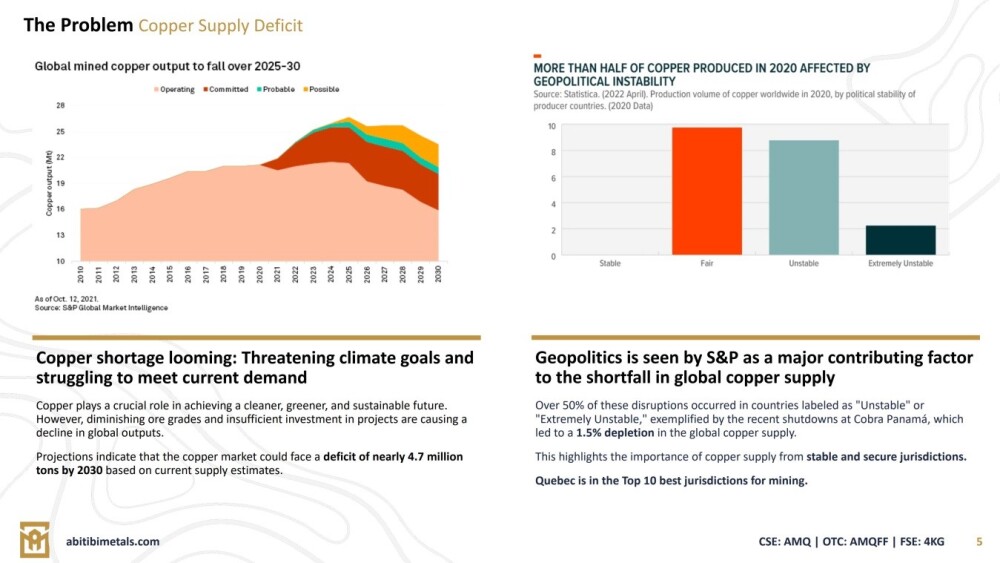
The following slide sets out the reasons for the looming severe copper supply deficit and the importance of producers having their operations in stable and secure jurisdictions, such as Quebec.
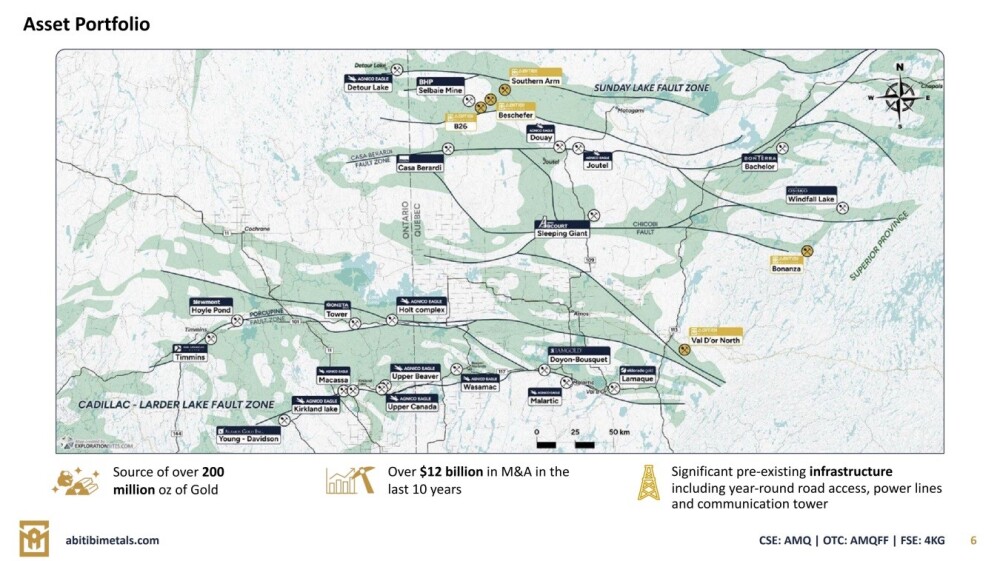
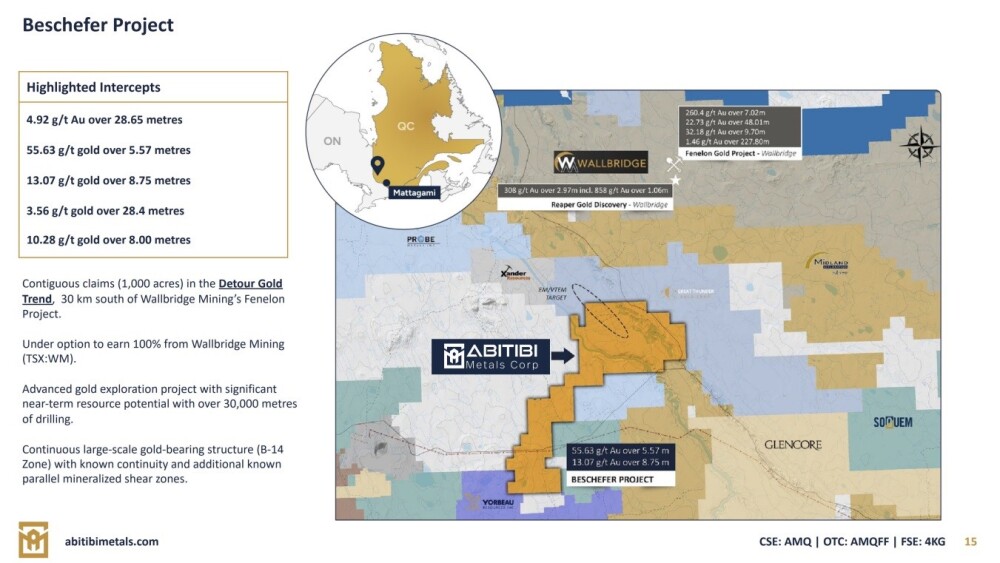
The following map shows the locations of the company’s properties not just in relation to each other but also with respect to other significant companies and their mines and prospects in the district.
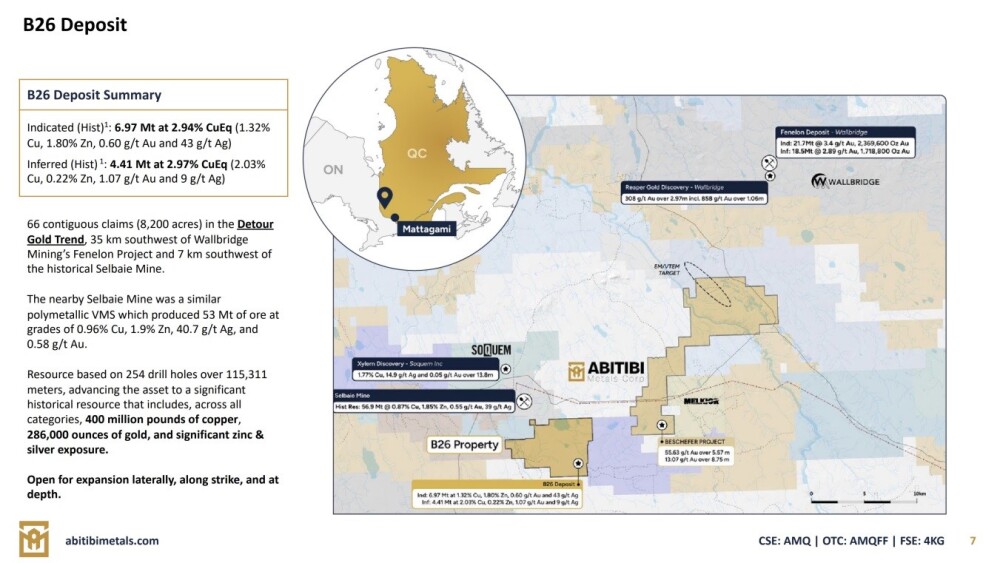
This slide gives the location and extent of the B26 Deposit and also sets out some important details of the deposit.
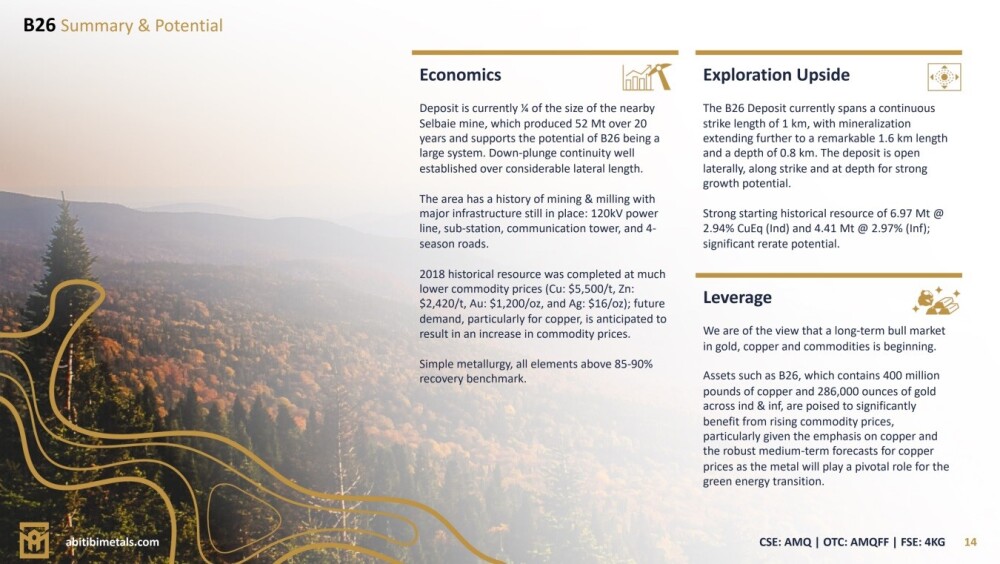
And this one summarizes the economics and potential of the B26 Deposit and its capacity to leverage the impending major metals bull market.
Details of the nearby Beschefer Project, which is currently in the exploration phase, are set out on this slide.
The last slide details the capital structure and the most important takeaway from this is that only 31% of the almost 110 million shares in issue are in the float.
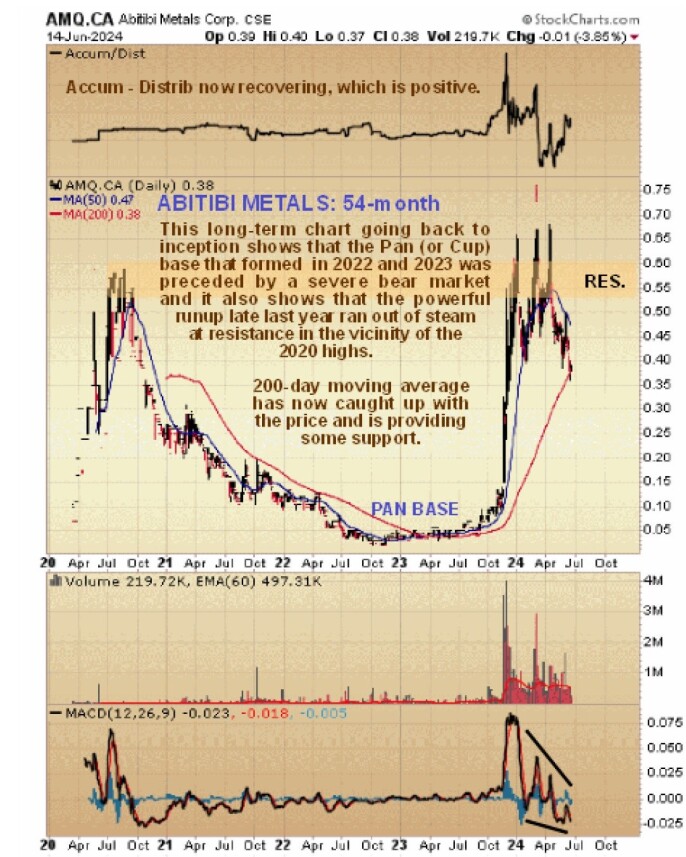
Turning our attention now to the charts for the company’s stock, we will start with the long-term chart to obtain a Big Picture perspective.
Starting with the 54-month (4-year 6-month) chart, which shows the stock from its inception in 2020, we see that it has made several massive swings. After coming to market we see that it ran up swiftly from about C$0.07 to peak at about C$0.58 just a few months later. After topping out it then went into a severe bear market that lasted well over 2 years with it hitting bottom late in 2022. A low Pan (or Cup) base then formed which completed late in 2023 with an explosive high volume rally on the news that (after a name change) the company was moving to acquire an 80% interest in the big B26 deposit as mentioned above. The last point to observe on this chart before moving on to shorter-term ones is that the powerful rally ran out of steam once the price had gotten up to the vicinity of the 2020 highs, where there is resistance.
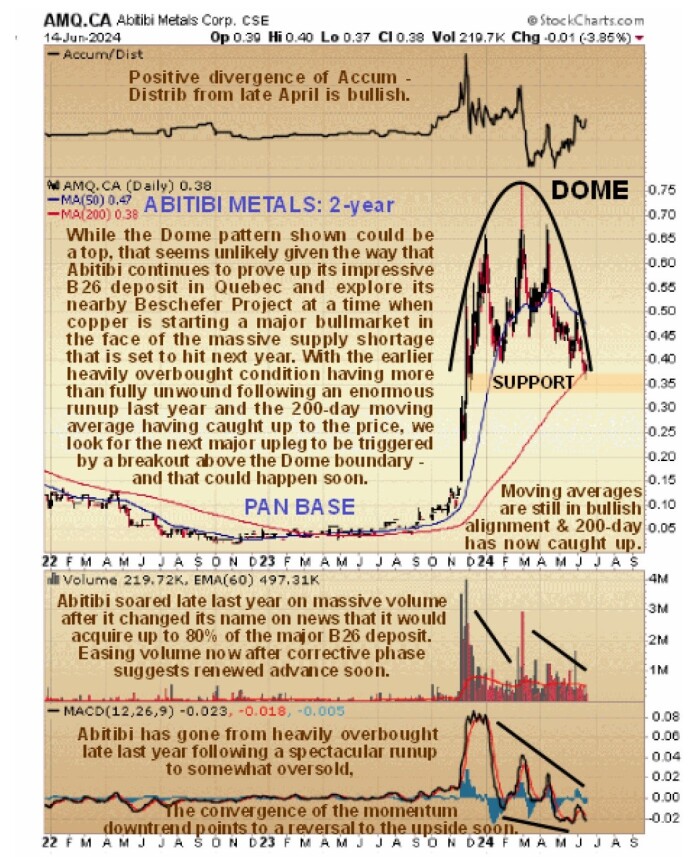
Zooming in now via the 2-year chart enables us to see the large Cup base and the powerful rally that it led to in somewhat more detail. The first important point to observe on this chart is that the spectacular rally late last year resulted in the stock becoming massively overbought, calling for a long period of consolidation / reaction which is exactly what we have since seen. The 2nd important point to take note of is that the persistent very heavy volume driving the big runup had – and has – major bullish implications, hardly surprising considering what the company achieved at that time. For this reason the consolidation / reaction that we have seen since the February peak is expected to lead to a breakout into another major upleg. We can also see on the chart that the price has rounded over beneath a large so-called “Distribution Dome” that has formed since late last year which is of course due to investors who bought at much lower levels in the past taking profits. These Dome patterns can sometimes mark major tops with the price breaking down and heading back towards where it came from, but that is considered highly unlikely in this case, not just because of the huge volume driving the prior advance but fundamentally because the company has acquired a major stake in a huge copper resource (and other metals) at a time when copper is starting a major bullmarket in the face of the impending severe shortfall and here it is worth mentioning that the significant correction in copper of the past month looks like it has about run its course. So, with the earlier heavily overbought condition of many months ago having more than fully unwound, as shown by the MACD indicator and the rising 200-day moving average having now caught with the price so that it is providing support, the chances of the price breaking to the upside are rapidly improving.
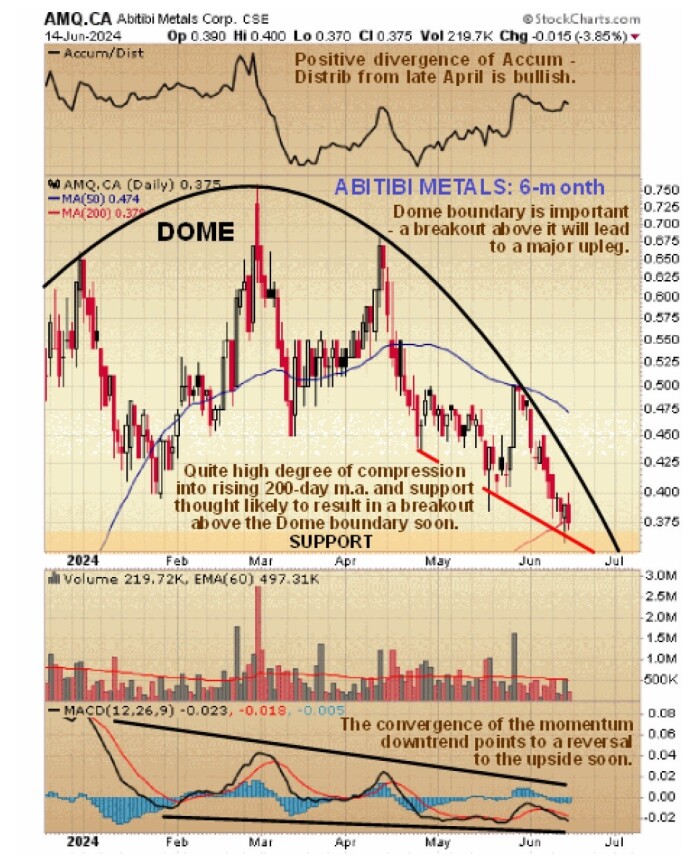
Lastly, on the 6-month chart, we can see recent action in much more detail and in particular how, as the price has dropped back over the past several weeks to support at the rising 200-day moving average and support at the short-term trendline shown, the Accumulation line has been showing a marked positive divergence and advancing while the MACD indicator has at the same time not confirmed the new lows. These are signs that it is likely to reverse to the upside soon, and as we can see on this chart, it won’t take much of a move for the price to break clear above the restraining Dome boundary and once it does it will trigger an abrupt change of sentiment that will cause sellers to back off which should lead to a strong rally.
With a reversal to the upside looking likely soon, Abitibi Metals is rated an immediate strong buy for all time horizons.
Abitibi Metals <A HREF="https://abitibimetals.com/">website</A>
Abitibi Metals Corp., AMQ.CSX, C$0.38, AMQFF on OTC, $0.275, FRA:4KG. Prices for close of trading on 14th June 24.


