

In this article, we are going to see why Revolve Renewable Power Corp. (REVV:TSX; REVVF:OTCQB) looks set to commence a major bullmarket as it just starts to advance out of a large low base pattern.
The 33-month arithmetic chart is our starting point as it provides us with a broad overall perspective. On this chart, we can see how, following a dramatic spike in the Spring of 2022, the price quickly collapsed back to a very low level to make the first low of a giant double-bottom base pattern.
After trending steadily higher for many months in a measured manner from this low and well into 2023, it reversed into an equally measured downtrend that brought it back to the Summer 2022 lows, with which it formed the second low of a Double Bottom last Fall, and we can also see that it then started to advance out of this low.
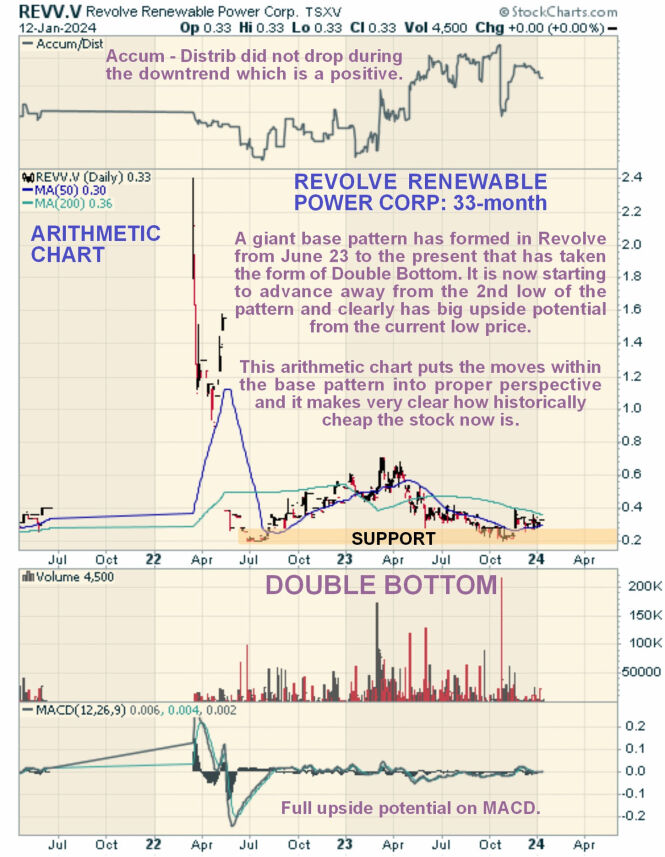
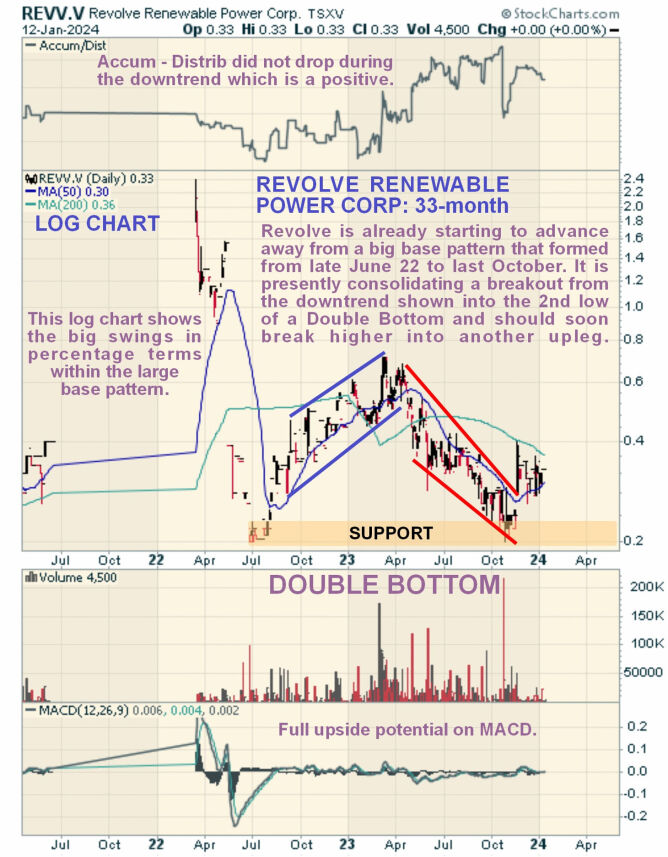
It is also worth looking at the logarithmic chart for this 33-month period as it "opens out" the base pattern, enabling us to see what was going on within it in more detail.
In particular, this log chart makes clear that even though the price was still within the base pattern, the percentage price swings within it were sizeable — it more than tripled in price on the uptrend from the first low of the Double Bottom before losing it all again as it drifted down to form the second low of the Double Bottom.
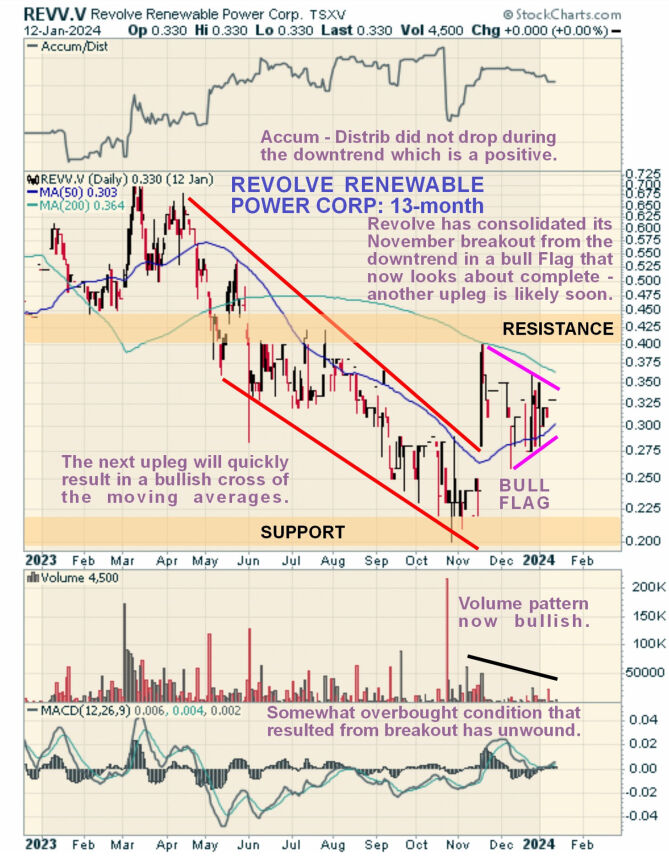
On the 13-month chart, we can see the downtrend into the second low of the Double Bottom in detail and how the price broke sharply and decisively out of its just last November, a move that it believed to mark the beginning of a new bullmarket in the stock.
Following this breakout move, the price has consolidated in what is believed to be a bull Flag or Pennant, and with its boundaries closing up and volume having dwindled in a satisfactory manner, this Flag looks to be about complete so that another sharp upleg is to be expected soon that will quickly lead to a bullish cross of the main moving averages.
Supporting renewed advance are the overall positive trend of the Accumulation line and the neutralization of the MACD indicator following its having become somewhat overbought on the sharp break higher in November.
The 6-month chart enables us to observe some less obvious but important details that are not easy to spot on long-term charts. So, we see that the breakout from the downtrend that occurred in November was accompanied by good volume and a gap, which has longer-term bullish implications.
We can also see that the plunge in the Accumulation line on one day in October appears to have been caused by a sizeable "cross" trade (although this has not been verified), and if so, it is an anomaly that can be ignored, apart from making the observation that a cross trade in this position after a decline is normally bullish.
We can also see to advantage how the duration of the Flag / Pennant pattern has allowed time for the converging moving averages to draw closer together, creating the setup for another and possibly stronger upleg that will quickly lead to a bullish cross of the averages, as mentioned above. Lastly, after being in retreat, the MACD indicator has climbed back above its own moving average, which is a development that often precedes a period of advance.
The conclusion is that all the technical factors described here are converging to indicate that Revolve Renewable Power Corp. is set to embark on a significant bull market advance from the current low level, which, although it has already started, is still in its very earliest stages.
Revolve is therefore rated a Strong Buy for all timeframes.
Revolve Renewable Power Corp.'s website.
Revolve Renewable Power Corp. closed at CA$0.32 on January 17, 2024.
| Do you want the latest investment ideas delivered to your inbox? Sign up to receive the FREE Streetwise Reports' newsletter. | Subscribe |


