

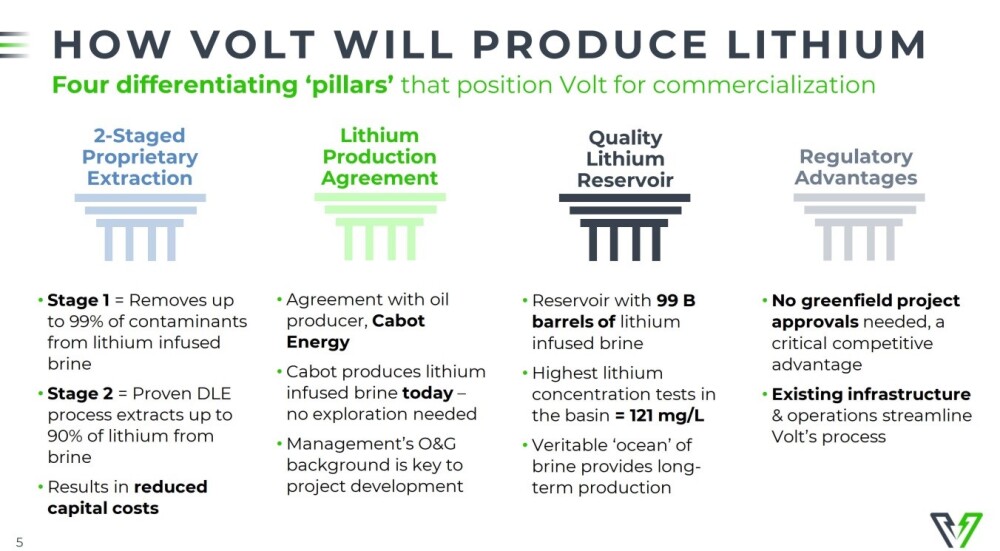
Volt Lithium Corp. (VLT:TSV;VLTLF:US) is unique in that it is positioned to be the first commercial producer of lithium from oilfield brine in North America. Lithium brine is often a byproduct of oil and gas extraction since they can occur together, and Volt's technology opens the door to a symbiotic relationship with any number of oil companies who can partner with it to produce lithium in a manner that is profitable for both parties and they have already signed a cooperation agreement with Alberta-based oil and gas producer Cabot Energy and are looking to ink much bigger deals with sizeable oil companies south of the border where lithium grades may be much higher.
This oilfield lithium brine is often at low concentrations, but Volt has developed the technology to profitably extract it. A successful pilot project has already been completed, and a preliminary economic assessment is underway. Another advantage that will expedite the success of the economics of the process for the company is that Volt has targeted reservoirs with existing infrastructure and brine production, which will speed up the commercialization process, as set out on slide three of the company's latest investor deck.
How Volt will produce lithium is set out on slide five of the deck, which, for convenience and because it is so important is reproduced below.
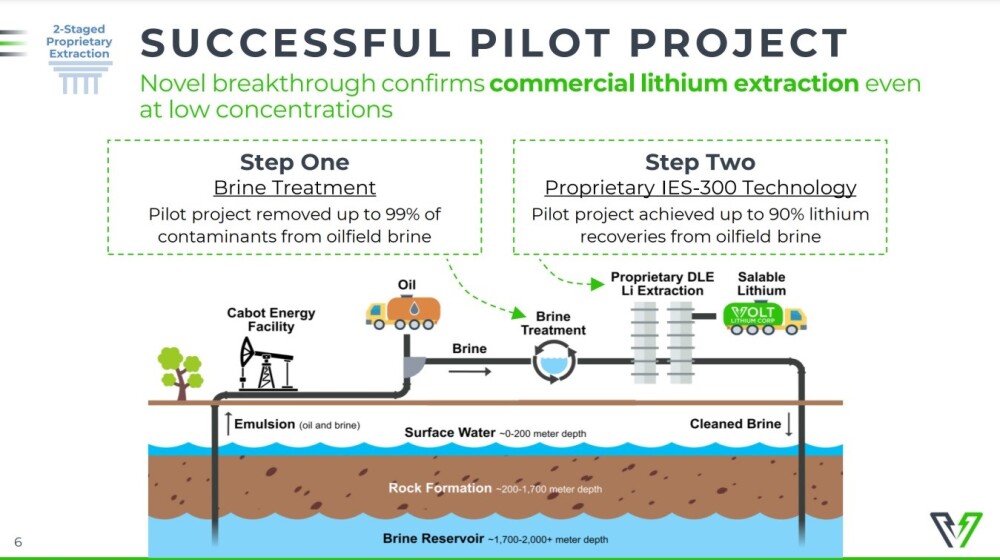
The successful extraction of lithium from oilfield brine is a two-stage process as set out in the deck on slide six, which is reproduced below.
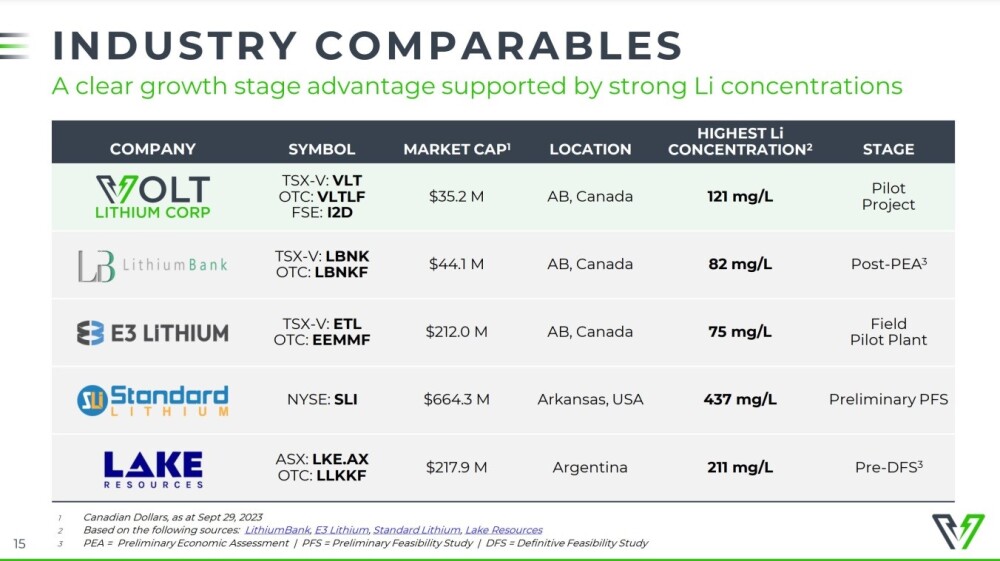
Here is how Volt compares with other companies in the field, which is slide 15 of the deck.
Amongst various positive news announcements by the company in recent months we have Volt Lithium pegs Rainbow posttax NPV at $1.1B (U.S.)</A>. in which, amongst other information, it details that production at the company's Rainbow Lake lithium Project in Alberta is expected to ramp up from 1,000 to over 23,000 metric tonnes per year of battery-grade lithium hydroxide monohydrate (lithium hydroxide or LHM) over a 19-year period.
Then, on January 31, there was big news out of the company that it had achieved successful production of battery-grade lithium carbonate at its permanent demonstration plant in Calgary.
The president of the company, Alex Wylie, commented, "I am thrilled to confirm that the Volt team continues to advance our DLE capabilities at our demonstration plant and showcased our ability to transform oil field brine into a commercially saleable grade of lithium carbonate. Bringing the full-cycle process in-house greatly reduces the cost to produce lithium carbonate, which is expected to enhance margins and position Volt as a low-cost operator. We believe oil and gas producers across North America who are keen to monetize value from their produced water can benefit from Volt's fully self-contained, cost-effective and environmentally sustainable solution to help meet the world's growing need for lithium."
More positive news appeared just days ago, on the 21st, stating that the company had reduced operating costs by 64%. This reduction builds on the company's past success in streamlining the DLE (Direct Lithium Extraction) process and driving down costs in order to support robust margins for Volt's production of lithium carbonate, even within a volatile price environment for lithium.
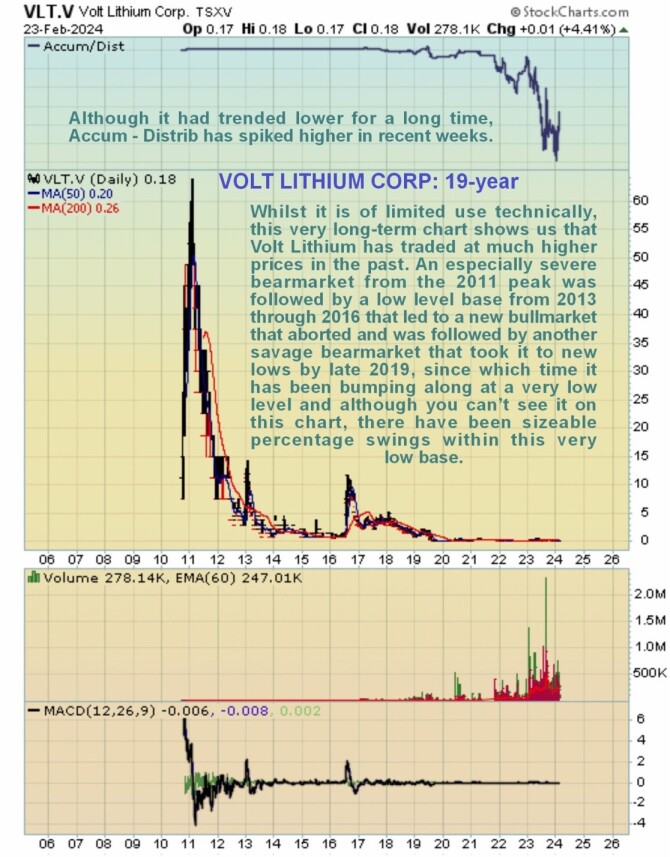
Turning now to the charts for the stock, it is most efficacious in the case of Volt Lithium to adopt a "Russian Dolls" approach, that is, start with the big picture and zoom in in stages. Before going any further, it should be pointed out that we should not try to read too much into Volt's longer-term charts. This is because, due to the company being taken over by Allied Copper early last year, which then changed its name back to Volt, in an operation that substantially increased the number of shares in issue, it is, to a large degree, a different entity.
Starting with the very long-term chart going back 19 years, this timeframe being selected to stop the data on the left of the chart obscuring the 2011 peak, we see that in the past, Volt has traded at far higher prices than have prevailed recently with it having almost touched CA$65 back at the 2011 peak although admittedly it didn't stay at that lofty level for long.
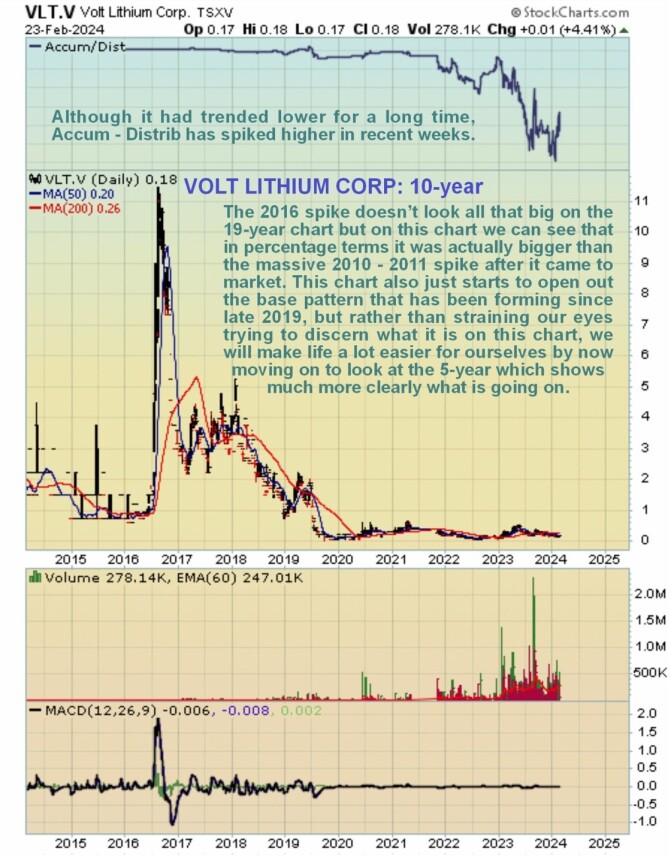
After that peak, it went into a brutal and relentless bear market that resulted in it becoming almost worthless between late 2013 and mid-2016. In mid-2016, it had a secondary or "echo" bull market, which didn't amount to more than a short-lived but dramatic spike, and although it doesn't look like much on this chart, it actually resulted in huge percentage gains. After that, it lapsed into another severe bear market, which ended up taking it even lower than the first big bear market by the time it ran its course in late 2019. We'll now zoom in on that period using a 10-year chart.
On the 10-year chart, we can see that the mid-2016 spike, which doesn't look very impressive on the 19-year chart, was actually a big deal at the time, and it resulted in even greater percentage gains than the earlier massive spike in 2011.
A horrendous bear market followed that rendered the stock almost worthless by late 2019, and it has been bumping along the bottom ever since.
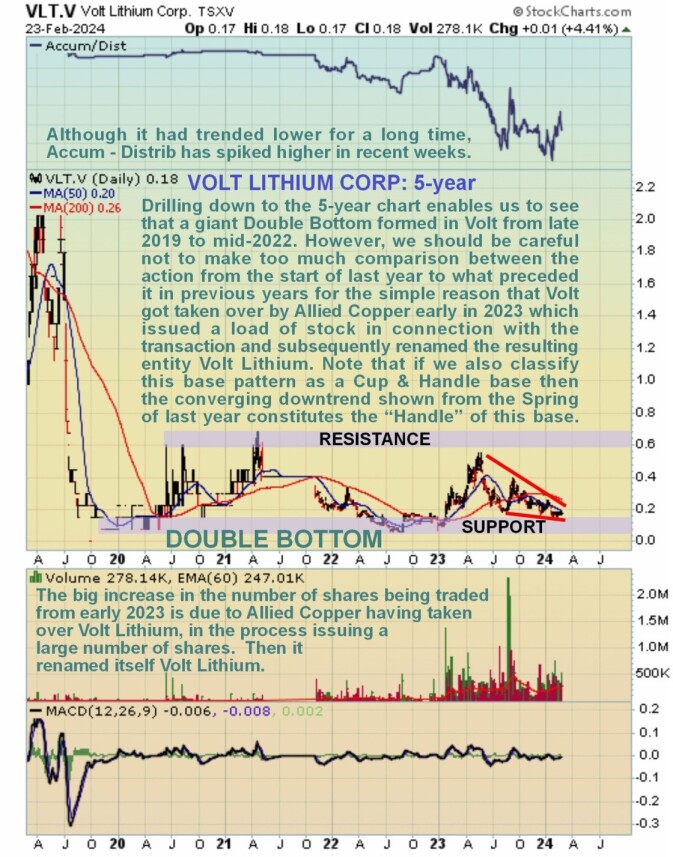
On the 5-year chart, we can "open out" the base pattern that has formed since late 2019 the better to see exactly what has been going on. On this chart, we can see that a large Double Bottom has been completed, with its first low being in late 2019 – early 2020 and its second low being in mid-2022 – early 2023, completing right at the time of the Allied Copper takeover, which is viewed as no coincidence.
The strong advance during the early months of last year following the Allied Copper takeover completed the Double Bottom pattern and is believed to be the preliminary upleg of a new bull market, preliminary because the bull market proper won't get started until the price breaks above the resistance shown at the upper boundary of the entire base pattern, i.e., above CA$0.60 – CA$0.70 and investors and would-be investors in the stock should take note of the fact that by the time the stock does break out of the base pattern it will have already made a threefold gain from the current price.
This is in large part because the reaction that followed the upleg early last year, which has taken the form of a bullish Falling Wedge, has brought the price back to a most favorable entry point for new investors, where it is perched just above the strong support shown.
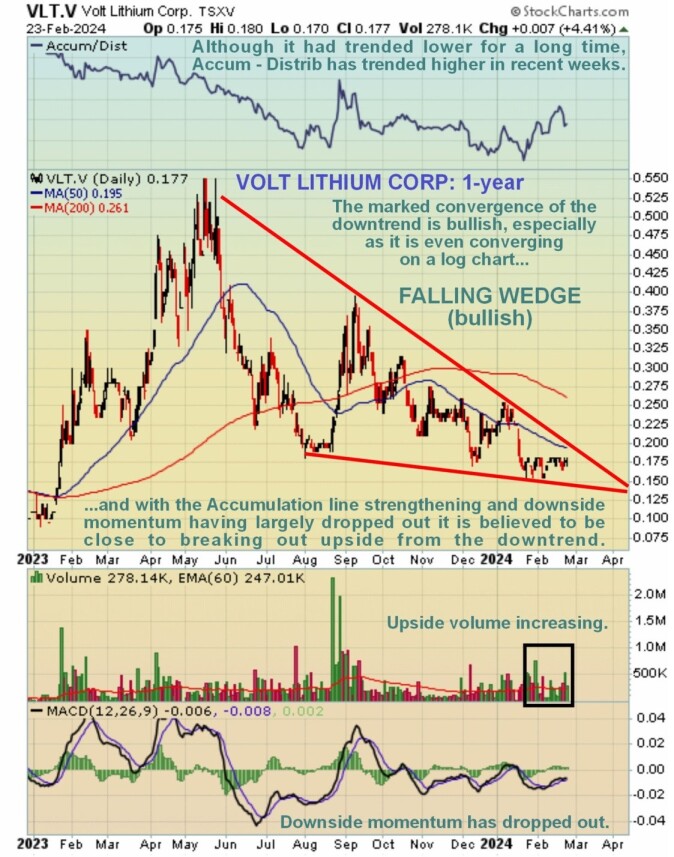
Zooming in again via the 1-year chart enables us to examine the entire period from the Allied Copper takeover early last year in detail. The uptrend during the first few months of last year resulted in very impressive gains by the time it had run its course in May. Then, a heavy reaction set in that we can now see has taken the form of a large bullish Falling Wedge whose boundaries are strongly converging, making it all the more bullish, and these boundaries are even converging when viewed on a log chart.
A key point to observe is that this Wedge is now closing up, which means that a breakout is imminent, and all the indications are that it will be to the upside. We can see a marked increase in upside volume over the past five weeks or so, also evidenced by the now uptrending Accumulation line.
This is a strongly bullish indication, especially as downside momentum, shown by the MACD indicator, has pretty much fizzled out. Whilst moving averages are still in bearish alignment, the volume pattern is telling a positive story, and it won't take all that much of an advance to swing moving averages into much better alignment.
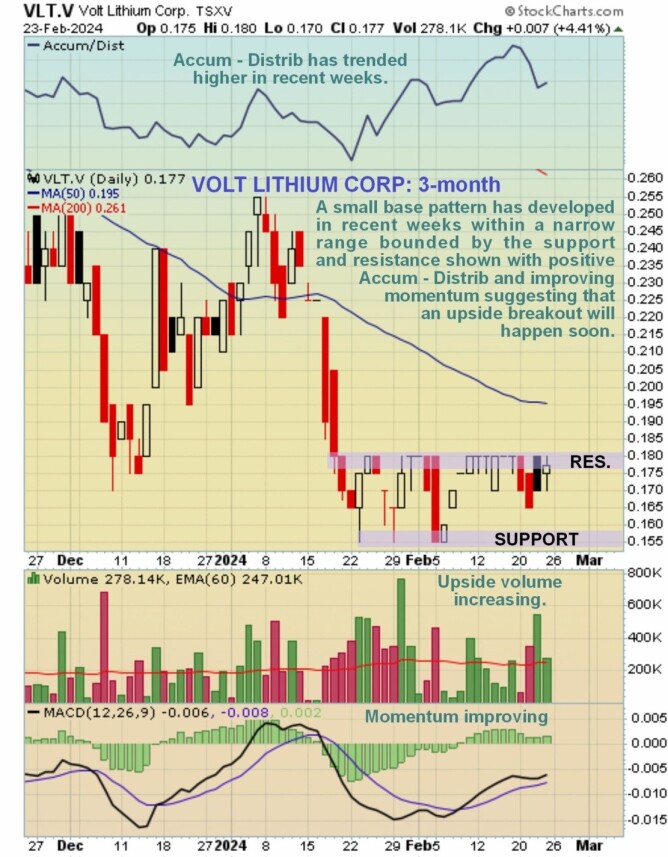
Lastly, we will zoom in yet again to examine the most recent action on a 3-month chart. Here, we see that a low Cup-like base has been forming since mid-January beneath a clear line of resistance at 18 cents, whose duration has allowed the 50-day moving average to drop down much closer to the price.
Notice the dramatic shift to mostly upside volume as this little pattern has built out, which is why the Accumulation line has been trending higher. This price / volume action promises an upside breakout from this small Cup and, more than that, a breakout from the large Falling Wedge that we looked at on the 1-year chart and such a breakout could lead to a vigorous uptrend developing.
The conclusion is that the setup is very bullish, with Volt being at a most favorable entry point, and it is rated an Immediate Strong Buy for all timeframes. The number of shares in issue as of October 2, 2023, is 130.3 million, according to the company investor deck.
Volt Lithium's website.
Volt Lithium closed at CA$0.177, $0.13 on February 23, 2024.
| Want to be the first to know about interesting Cobalt / Lithium / Manganese investment ideas? Sign up to receive the FREE Streetwise Reports' newsletter. | Subscribe |
Important Disclosures:
- Volt Lithium Corp. has a consulting relationship with an affiliate of Streetwise Reports, and pays a monthly consulting fee between US$8,000 and US$20,000. For this article, the Company has paid Street Smart, an affiliate of Streetwise Reports, US$1,500 in addition to the monthly consulting fee.
- As of the date of this article, officers and/or employees of Streetwise Reports LLC (including members of their household) own securities of Volt Lithium Corp.
- Author Certification and Compensation: [Clive Maund of clivemaund.com] was retained and compensated as an independent contractor by Street Smart to write this article. Mr. Maund is a technical analyst who analyzes historical trading data and he received his UK Technical Analysts’ Diploma in 1989. The recommendations and opinions expressed in this content reflect the personal, independent, and objective views of the author regarding any and all of the companies discussed. No part of the compensation received by the author was, is, or will be directly or indirectly tied to the specific recommendations or views expressed.
- Statements and opinions expressed are the opinions of the author and not of Streetwise Reports, Street Smart, or their officers. The author is wholly responsible for the accuracy of the statements. Streetwise Reports requires contributing authors to disclose any shareholdings in, or economic relationships with, companies that they write about. Any disclosures from the author can be found below. Streetwise Reports relies upon the authors to accurately provide this information and Streetwise Reports has no means of verifying its accuracy.
- This article does not constitute investment advice and is not a solicitation for any investment. Streetwise Reports does not render general or specific investment advice and the information on Streetwise Reports should not be considered a recommendation to buy or sell any security. Each reader is encouraged to consult with his or her personal financial adviser and perform their own comprehensive investment research. By opening this page, each reader accepts and agrees to Streetwise Reports' terms of use and full legal disclaimer. Streetwise Reports does not endorse or recommend the business, products, services or securities of any company.
For additional disclosures, please click here.
Clivemaund.com Disclosures
The above represents the opinion and analysis of Mr. Maund, based on data available to him, at the time of writing. Mr. Maund's opinions are his own, and are not a recommendation or an offer to buy or sell securities. As trading and investing in any financial markets may involve serious risk of loss, Mr. Maund recommends that you consult with a qualified investment advisor, one licensed by appropriate regulatory agencies in your legal jurisdiction, and do your own due diligence and research when making any kind of a transaction with financial ramifications. Although a qualified and experienced stock market analyst, Clive Maund is not a Registered Securities Advisor. Therefore Mr. Maund's opinions on the market and stocks cannot be construed as a recommendation or solicitation to buy and sell securities.


