

I frequently encounter remarks from traders declaring sentiments like "charting is useless" OR "these patterns don't apply to my specific holding because. . ." followed by lengthy explanations about how their particular security (stock ABC) has unique fundamentals and how everything will transform when some anticipated catalyst materializes for ABC.
What strikes me about these declarations is that these very same traders monitor their positions' market value obsessively throughout each trading day. They track price movements as if monitoring critical medical equipment, yet somehow dismiss the visual representation of that same price action and trading activity as worthless.
The truth is that certain individuals have corrupted this analytical discipline for personal gain, typically by pretending they possess the ability to forecast market direction with certainty. I suspect these distortions have soured many people on chart-based analysis. Consequently, they've concluded that visual price data holds little merit for their investment approach.
Allow me to clarify.
A crucial difference exists between discussing market developments as foregone conclusions versus discussing them through the lens of probability (typically no better than 60/40 odds).
"What is not surrounded by uncertainty cannot be the truth." ~ Richard Feynman
Without price charts, trading volume data, and market mood indicators, we'd essentially be navigating blindfolded through dense wilderness in complete darkness. Charts don't function as fortune-telling devices — they supply perspective. Perspective becomes invaluable when examined and decoded by an experienced observer.
Chart-based analysis represents the examination of markets through visual representations of participant actions. This methodology doesn't guarantee accurate future predictions. Quite the opposite. Actually, prediction isn't its intended purpose.
When applied properly, chart analysis helps us measure risk exposure, consider various possible outcomes, recognize directional movements, and pinpoint favorable entry and exit opportunities.
Price graphs tell an evolving story — a record of market psychology. Nothing beyond that. Our responsibility involves skillfully reading these patterns and separating meaningful signals from random fluctuations. This represents the challenging aspect, where individual interpretation becomes critical.
Rather than treating chart analysis like mystical divination or rejecting it completely, let's examine two recent cases demonstrating effective implementation:
Case Study: Alphamin Resources
(November 2024 - March 2025)
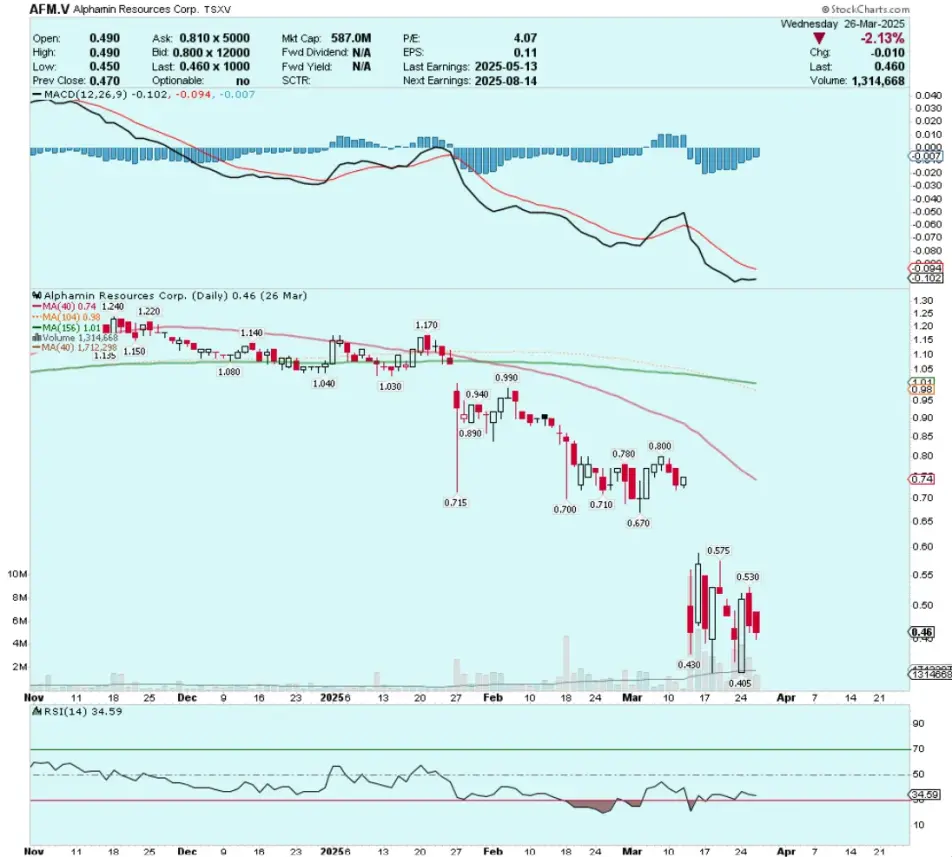
Alphamin Resources Corp. (AFM:TSXV; AFMJF:OTCMKTS; APH:JSE AltX) had been trapped in a severe declining trend since late 2024. That descent intensified in March following the company's announcement that it had suspended mining activities in east-central DRC due to armed rebel forces approaching their Bisie tin operation in the Walikale District.
I documented this position as it developed in real time through my blog: The Technical Analysis of Junior Mining Stocks: TA Is Bullish.
The circumstances surrounding AFM during late March and early April were unclear at best. Nevertheless, by grasping the chart's context (a prolonged decline that had reached the final surrender phase), I managed to see beyond the pessimistic news coverage and investor panic. I began observing that accumulation was occurring, demonstrated by the security's refusal to drop further and its subsequent upward movement.
This observation is crucial: market floors start with ascending lows, while market peaks begin with descending highs.
What followed?
(November 2024 - April 2025)
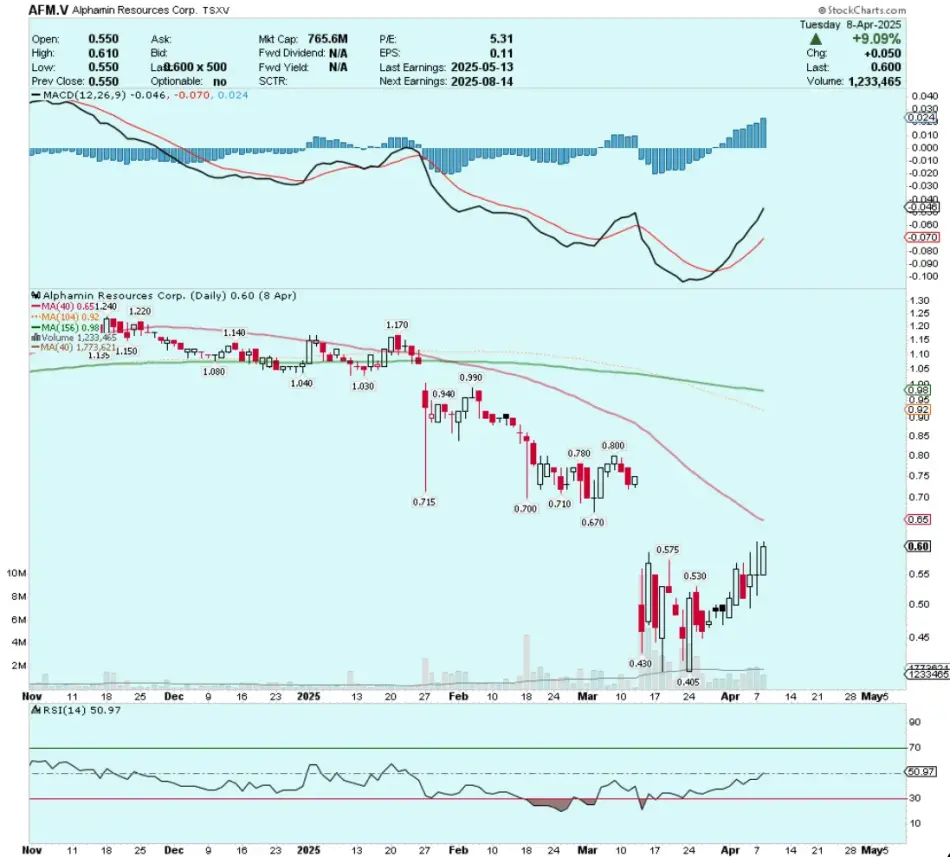
As worldwide markets experienced massive upheaval in early April, AFM shares started climbing. If any indication suggested positive developments were approaching, it was this remarkable bullish contradiction between AFM's price/volume behavior and plummeting equity indexes.
For context, on Tuesday April 8th, AFM shares jumped over 9% while BHP shares declined approximately 5% during that identical trading period.
I possessed no special knowledge regarding M23 insurgents and the DRC situation, but I could interpret the signals within the chart.
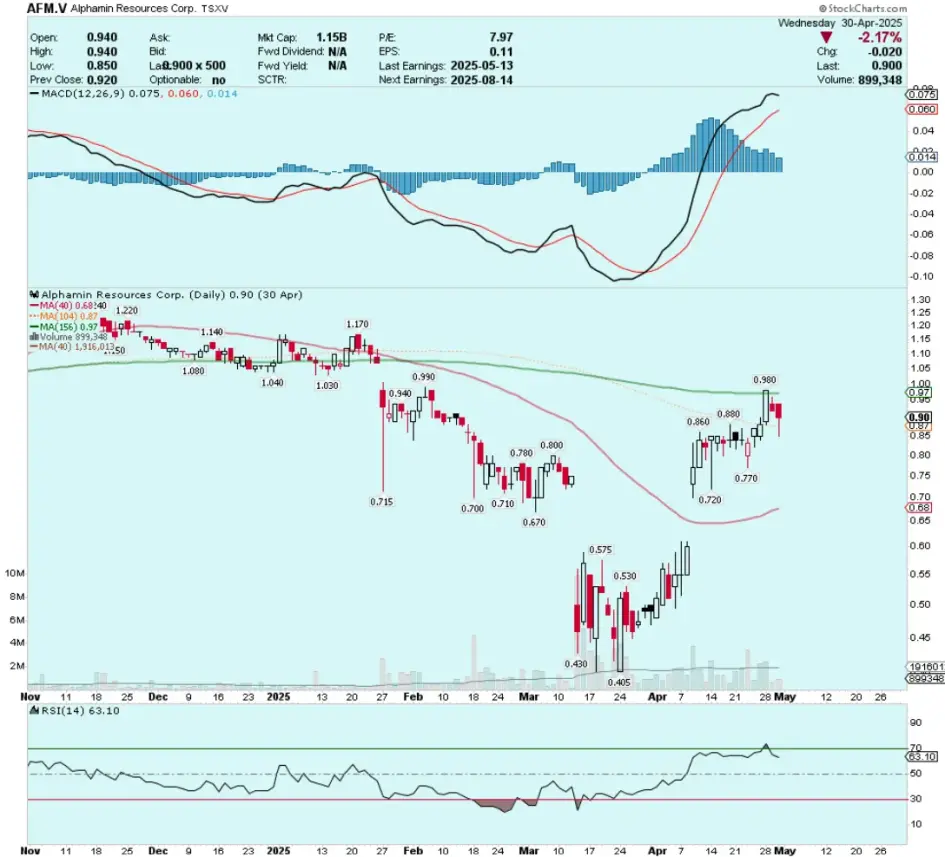
This setup ultimately produced a significant gap up in AFM on April 9th, followed by a several-week advance toward nearly $1.00 per share.
Daily
No sorcery was involved in recognizing this pattern-based reversal opportunity. It demanded understanding of the company's business fundamentals, some geopolitical awareness, and careful observation of price and volume dynamics in Alphamin shares.
Current Opportunity: Albemarle
An active setup is currently developing in Albemarle Corp. (ALB:NYSE). I highlighted it in last Friday's Charts of The Week and revisited it in the Weekly Video. The backdrop for the Albemarle opportunity involves a punishing 30+ month decline in the lithium space and the possibility of a chart-based reversal in the ALB pattern.
Here was last week's chart when I initially spotted the ALB configuration, shown through an ascending triangle approaching completion:
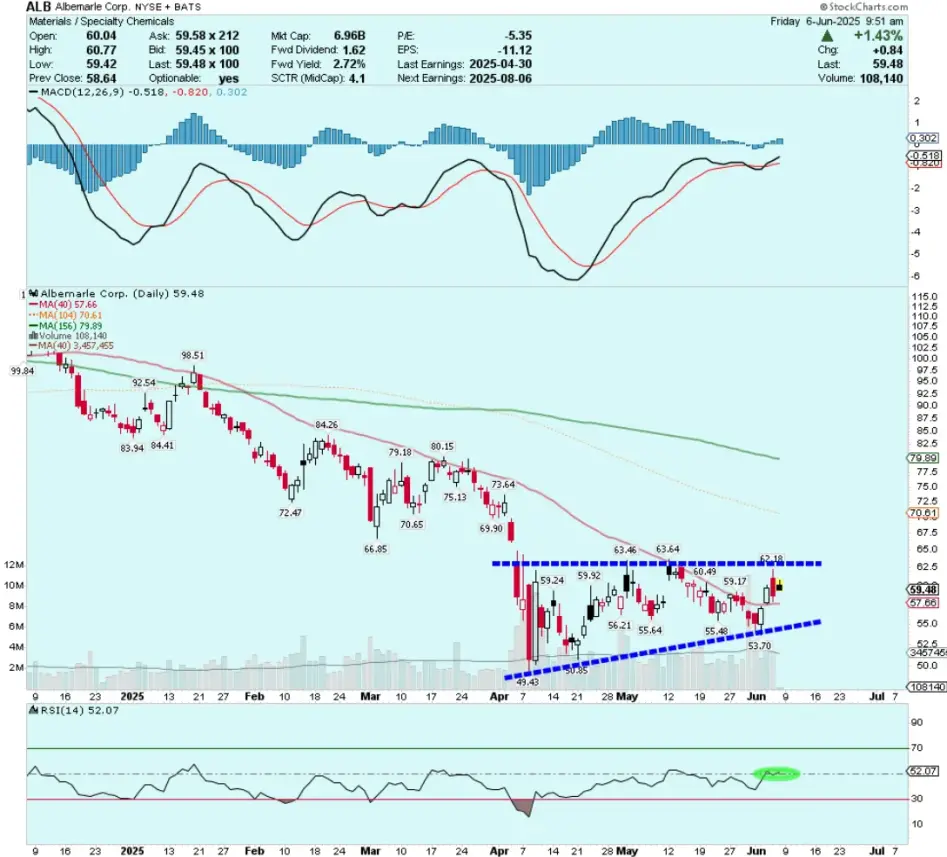
Nothing spectacular. Yet we observe the components of a steep capitulation drop in early April, followed by a multi-week consolidation forming an ascending triangle. The momentum indicators appeared positive with daily-RSI(14) above the centerline and two ascending lows established since the April 8th floor.
During 2022, ALB traded at $300 per share. It has declined over 80% from its peak during the 2022 lithium frenzy. Is that sufficient for a reversal to emerge?
Uncertainty remains, but I favor the probability of purchasing a security trading beneath its book value with a solid cash position. The 16.1% short interest sealed my decision, and I initiated the position last week.
![]()
Positions rarely perform this favorably immediately, but when they do, it's certainly encouraging.
Daily
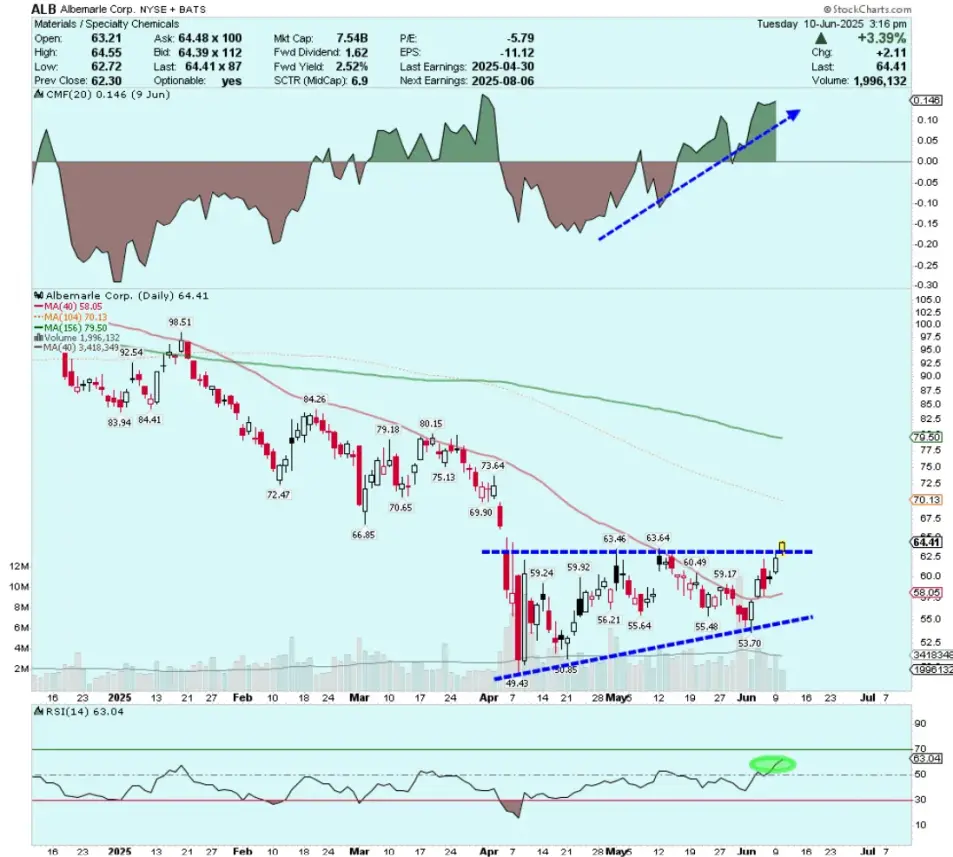
My initial upward objective is the unfilled gap at $66.50, followed by the second gap at $72.25. It's noteworthy that Albemarle's current book value (total assets minus total liabilities) corresponds precisely with the $66.50 level.
Exit strategies and the skill of letting profitable positions develop fully deserves separate discussion. However, I'll conclude with a brief explanation of calculating 'measured move objectives' from completed chart formations.
According to Bulkowski, ascending triangles reach their breakout objective 70% of the time. Consider this example for computing the price goal from the ALB ascending triangle:
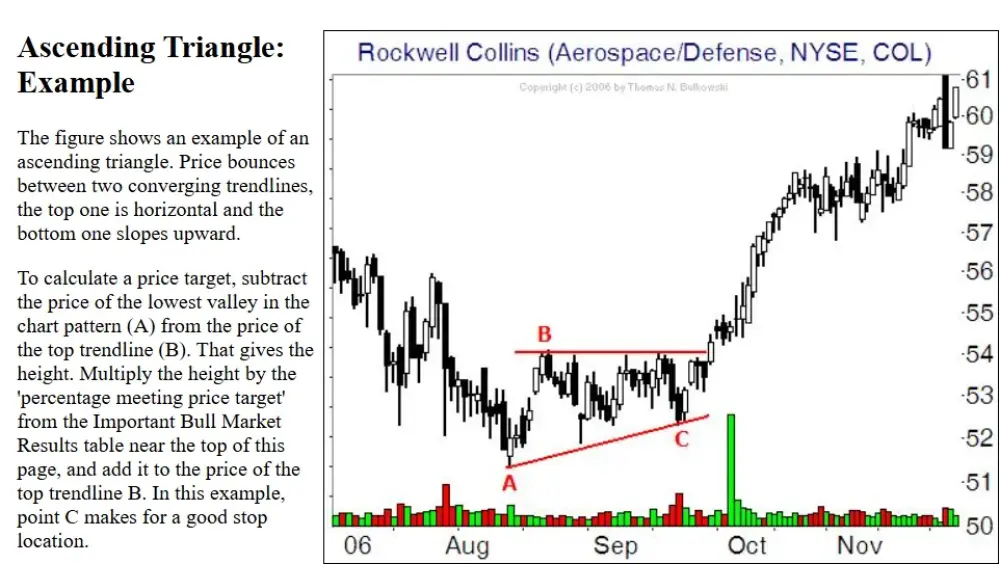
With ALB, the upper resistance line sits around $63 while the lowest support point is approximately $49.50. This provides us .70 x $13.50 = $9.45—adding the $9.45 to $63 yields a price objective of $72.45.
Isn't it striking how precisely this target matches the second unfilled gap in the ALB chart?
| Want to be the first to know about interesting Critical Metals and Base Metals investment ideas? Sign up to receive the FREE Streetwise Reports' newsletter. | Subscribe |
Important Disclosures:
- Robert Sinn: I, or members of my immediate household or family, own securities of: Albemarle Corp. My company has a financial relationship with: None. My company has purchased stocks mentioned in this article for my management clients: None. I determined which companies would be included in this article based on my research and understanding of the sector.
- Statements and opinions expressed are the opinions of the author and not of Streetwise Reports, Street Smart, or their officers. The author is wholly responsible for the accuracy of the statements. Streetwise Reports was not paid by the author to publish or syndicate this article. Streetwise Reports requires contributing authors to disclose any shareholdings in, or economic relationships with, companies that they write about. Any disclosures from the author can be found below. Streetwise Reports relies upon the authors to accurately provide this information and Streetwise Reports has no means of verifying its accuracy.
- This article does not constitute investment advice and is not a solicitation for any investment. Streetwise Reports does not render general or specific investment advice and the information on Streetwise Reports should not be considered a recommendation to buy or sell any security. Each reader is encouraged to consult with his or her personal financial adviser and perform their own comprehensive investment research. By opening this page, each reader accepts and agrees to Streetwise Reports' terms of use and full legal disclaimer. Streetwise Reports does not endorse or recommend the business, products, services or securities of any company.
For additional disclosures, please click here.
Robert Sinn Disclosures
The article is for informational purposes only and is neither a solicitation for the purchase of securities nor an offer of securities. Readers of the article are expressly cautioned to seek the advice of a registered investment advisor and other professional advisors, as applicable, regarding the appropriateness of investing in any securities or any investment strategies, including those discussed above. West Red Lake Gold Mines Ltd. is a high-risk venture stock and not suitable for most investors. Consult West Red Lake Gold Mines Ltd’s SEDAR profiles for important risk disclosures.
This article contains certain forward-looking information and forward-looking statements within the meaning of applicable securities legislation (collectively “forward-looking statements”). Certain information contained herein constitutes “forward-looking information” under Canadian securities legislation. Generally, forward-looking information can be identified by the use of forward-looking terminology such as “expects”, “believes”, “aims to”, “plans to” or “intends to” or variations of such words and phrases or statements that certain actions, events or results “will” occur. Forward-looking statements are based on the opinions and estimates of management as of the date such statements are made and they are subject to known and unknown risks, uncertainties and other factors that may cause the actual results, level of activity, performance or achievements of the Company to be materially different from those expressed by such forward-looking statements or forward-looking information, standard transaction risks; impact of the transaction on the parties; and risks relating to financings; regulatory approvals; foreign country operations and volatile share prices. Although management of the Company has attempted to identify important factors that could cause actual results to differ materially from those contained in forward-looking statements or forward-looking information, there may be other factors that cause results not to be as anticipated, estimated or intended. There can be no assurance that such statements will prove to be accurate, as actual results and future events could differ materially from those anticipated in such statements. Actual results may differ materially from those currently anticipated in such statements. Accordingly, readers should not place undue reliance on forward-looking statements and forward looking information. The Company does not undertake to update any forward-looking statements or forward-looking information that are incorporated by reference herein, except as required by applicable securities laws. Always thoroughly do your own due diligence and talk to a licensed investment adviser prior to making any investment decisions. Junior resource companies can easily lose 100% of their value so read company profiles on www.sedarplus.ca for important risk disclosures. It’s your money and your responsibility.


