

Laramide Resources Ltd. (LAM:TSX; LMRXF:OTCQX: LAM:ASX) is a long established uranium company that is very well positioned to benefit from the looming supply deficit that looks set to drive up the price of uranium and the push for domestic production of uranium in the U.S. and the sourcing of uranium from top tier jurisdictions such as Australia, especially as it has already delineated substantial resources in the U.S. and across the world . After many years of languishing at a low level, Laramide’s stock is in position to embark on a major bull market in response to these factors. Before reviewing the latest stock charts we will overview the company using a selection of pages from its latest investor deck.
First, some general points about uranium.
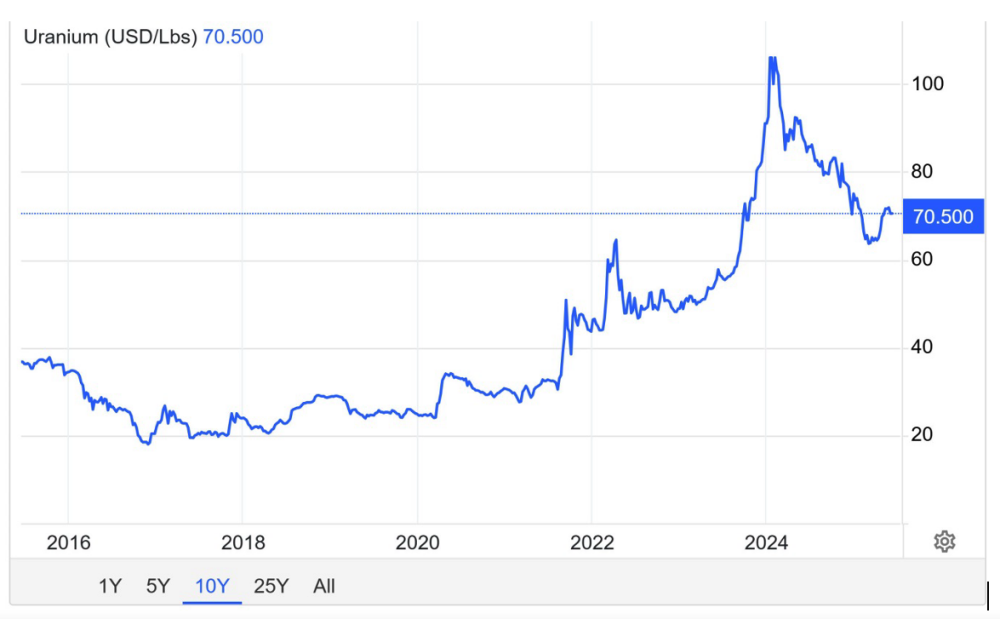
Uranium has been trending higher and accelerating to the upside following lows it put in, in 2016 and 2017, as can be seen on its five-year chart below. Right now, it is believed to be starting higher again following a deeper correction from its January highs back to the support of a parabolic uptrend…
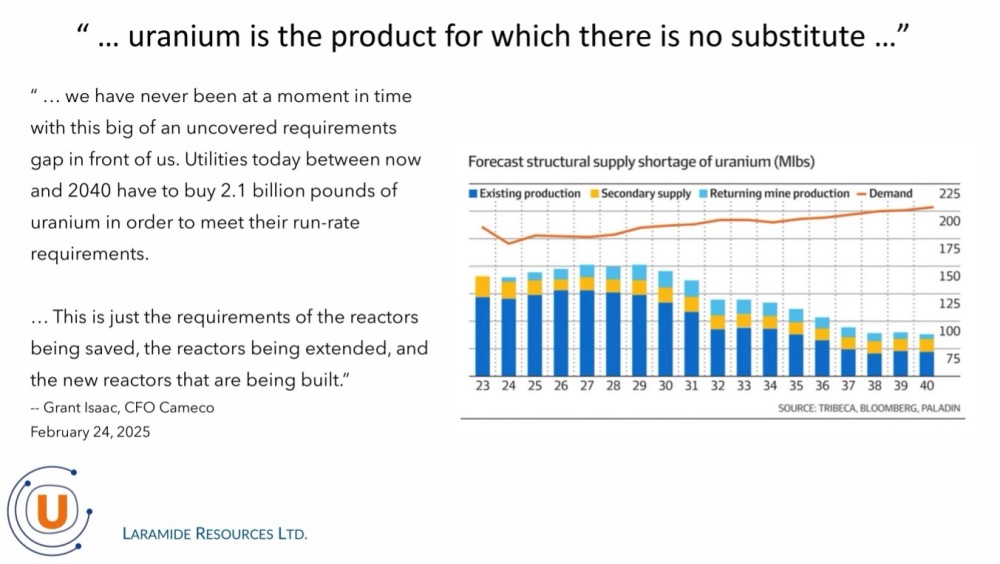
The graph on the following page shows that a supply deficit already exists and later this decade and especially during the next decade it is expected to start becoming much wider…
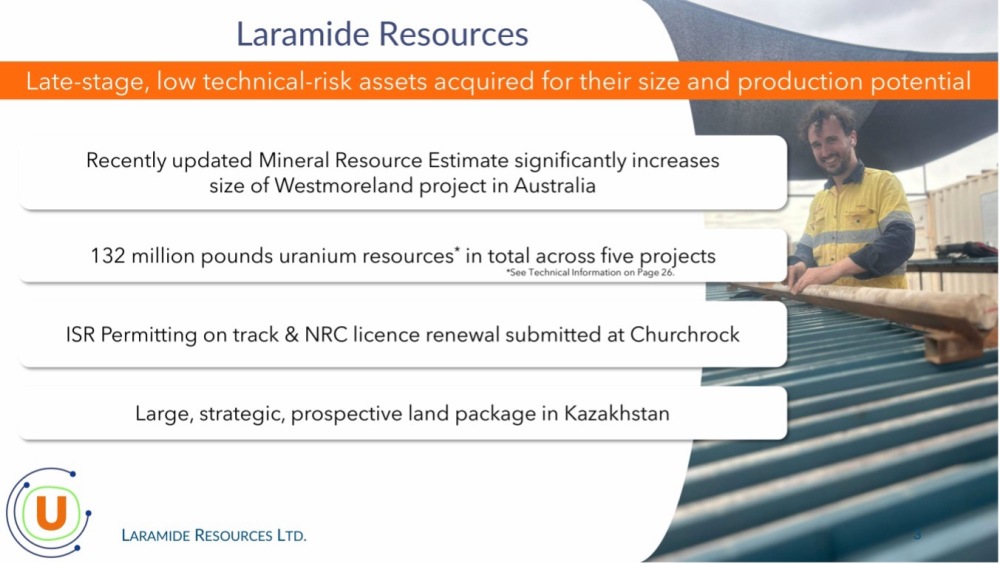
Turning now to Laramide itself, we see on the following page the principal attributes of the company listed…
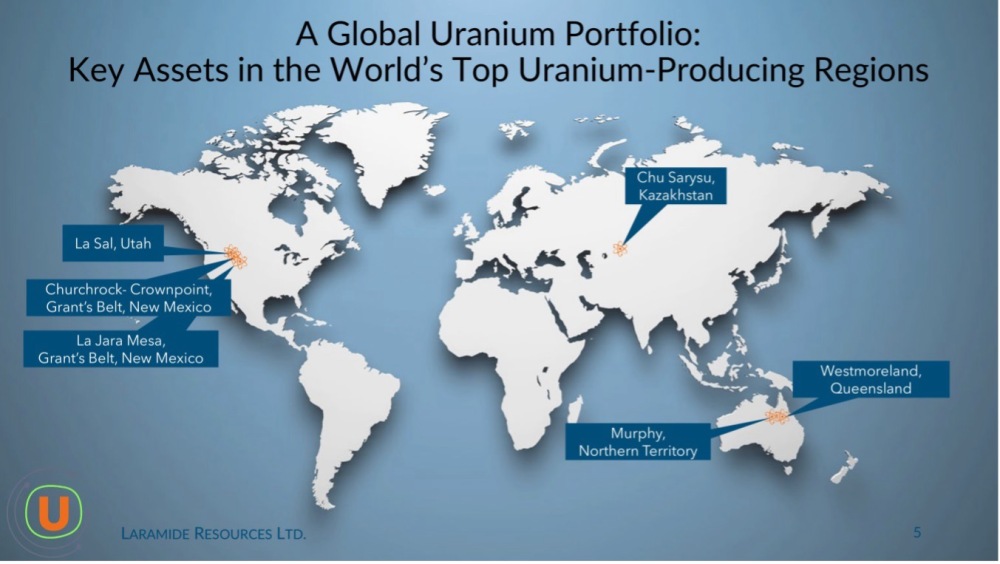
Laramide has a global uranium portfolio spanning Asia, Australia and North America…
Here is the timeline of development for the various projects shown on the previous page…
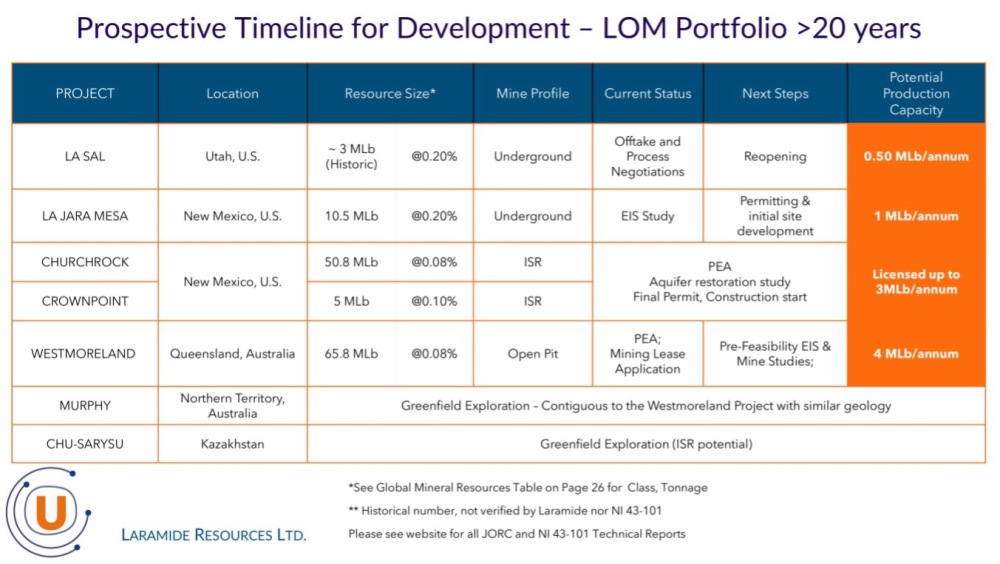
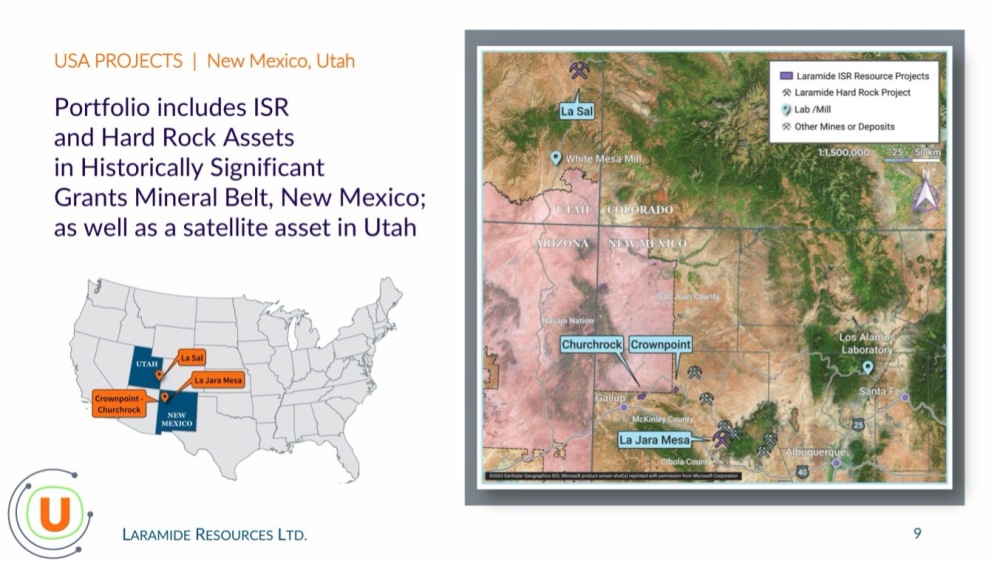
There are four projects in the U.S., three in relative proximity to each other in New Mexico: Churchrock, Crownpoint, and La Jara Mesa. The fourth project, La Sal, is in Utah. Their positions are shown on the map on the following page. This map also shows the location of the Los Alamos Lab to the east where the company is working in cooperation with the DOE (Dept. of the Environment)…
With the new emphasis on the domestic production of critical minerals and raw materials in the U.S., the company will “have the government at its back” as the following from the Secretary of Energy in Washington sent out earlier this year makes clear…

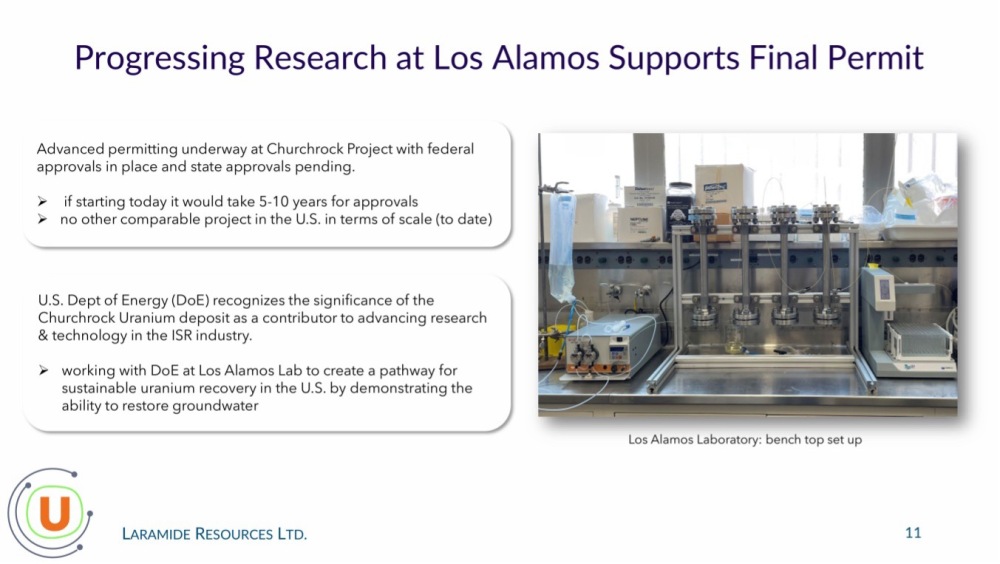
Progressing research at the Los Alamos Lab mentioned above supports final permitting…
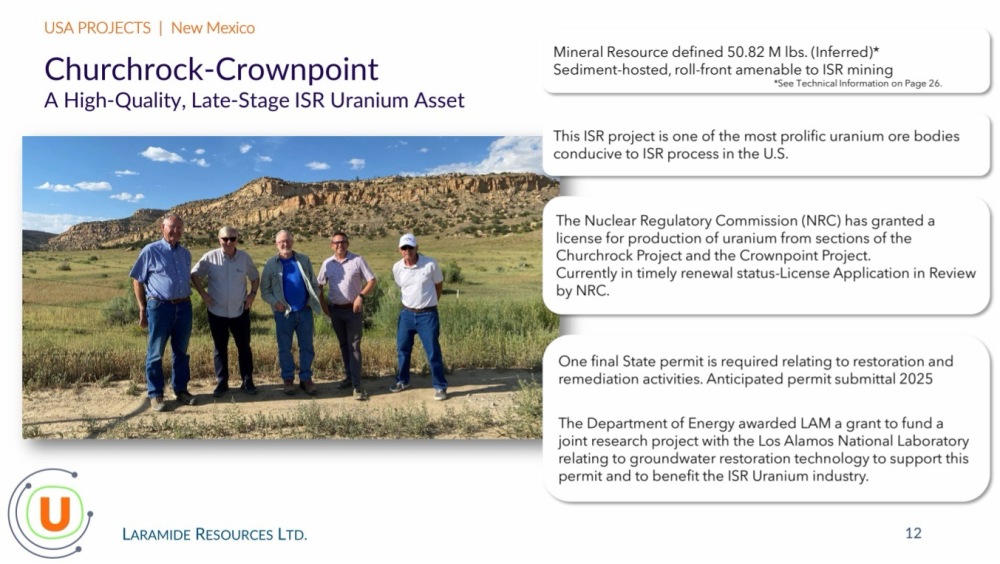
The next page overviews the Churchrock-Crownpoint projects. It is important to note that they are amenable to much more economic ISR mining.
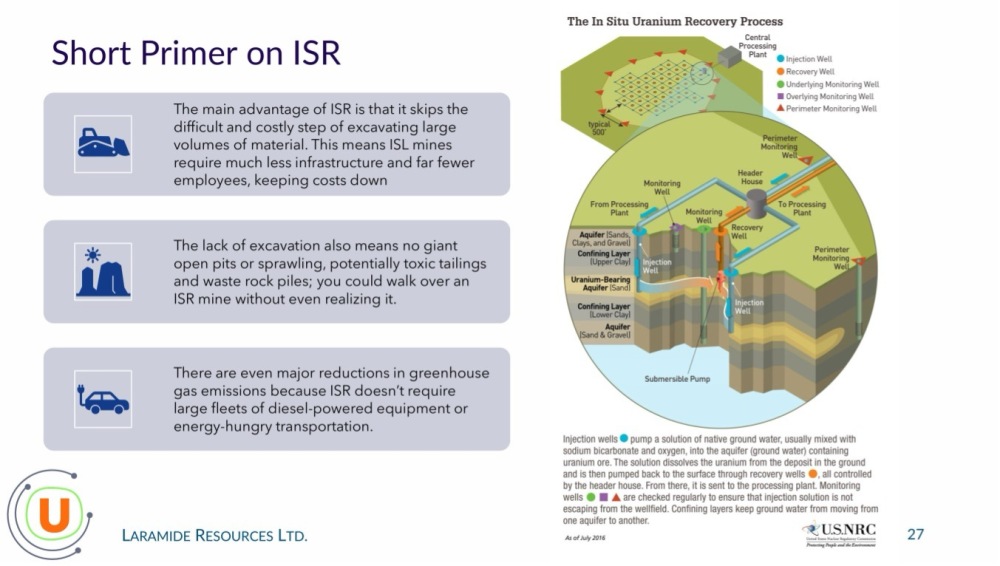
It is of general interest to briefly consider the ISR (In-situ Recovery) process, which in a nutshell involves pumping a solution into the deposit that dissolves the uranium which is then pumped out, thus avoiding the costly and environmentally problematic problems associated with excavating vast quantities of material. The following page shows how the ISR process works…
More information on the Churchrock–Crownpoint projects may be perused in the investor deck.
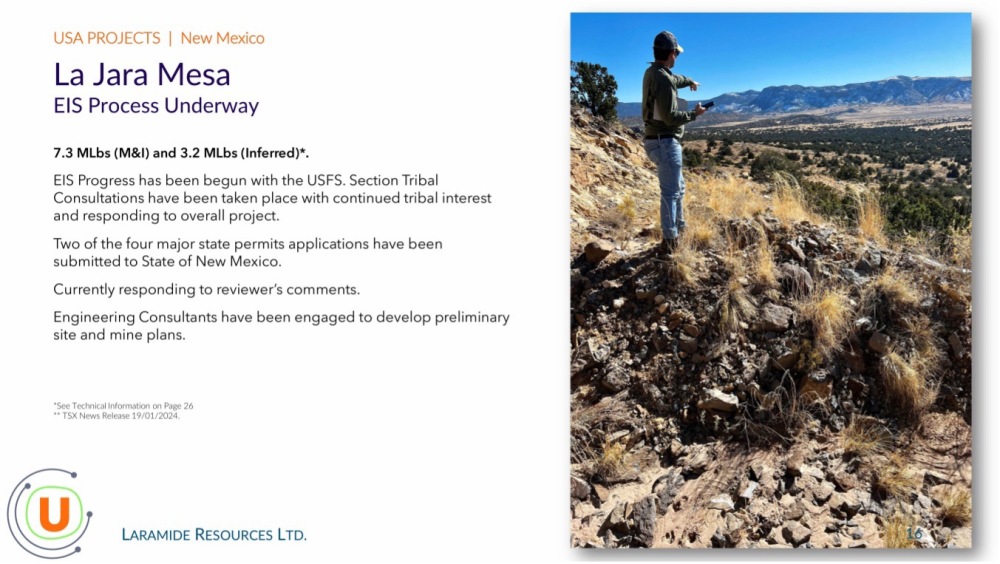
The La Jara Mesa Project in Utah is a smaller but promising uranium project…
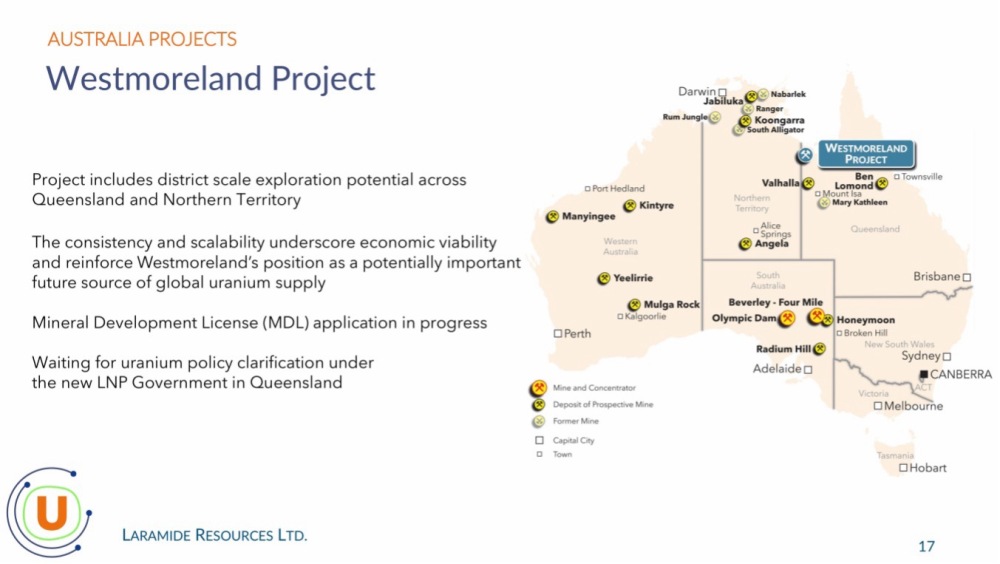
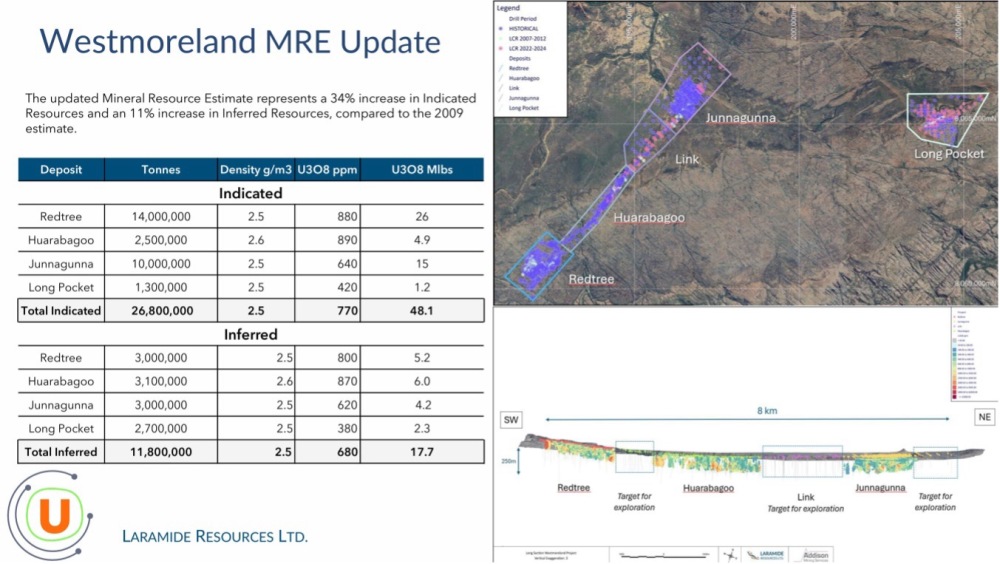
In Australia, the company’s Westmoreland Project straddles the borders of Northern Queensland and the Northern Territory…
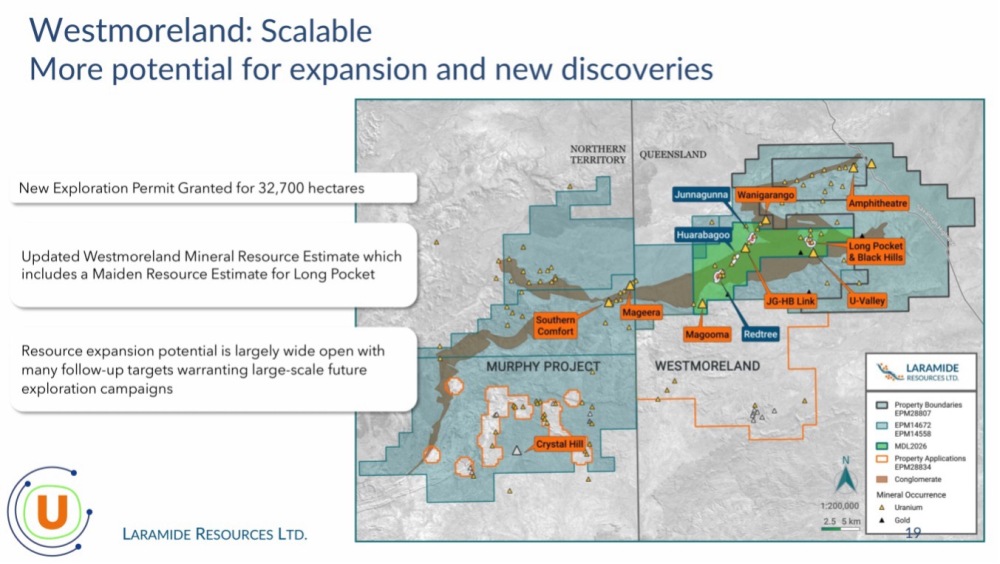
The project is substantial in scale with plenty of scope for expansion and new discoveries…
Here is the MRE (Mineral Resource Estimate) for Westmoreland…
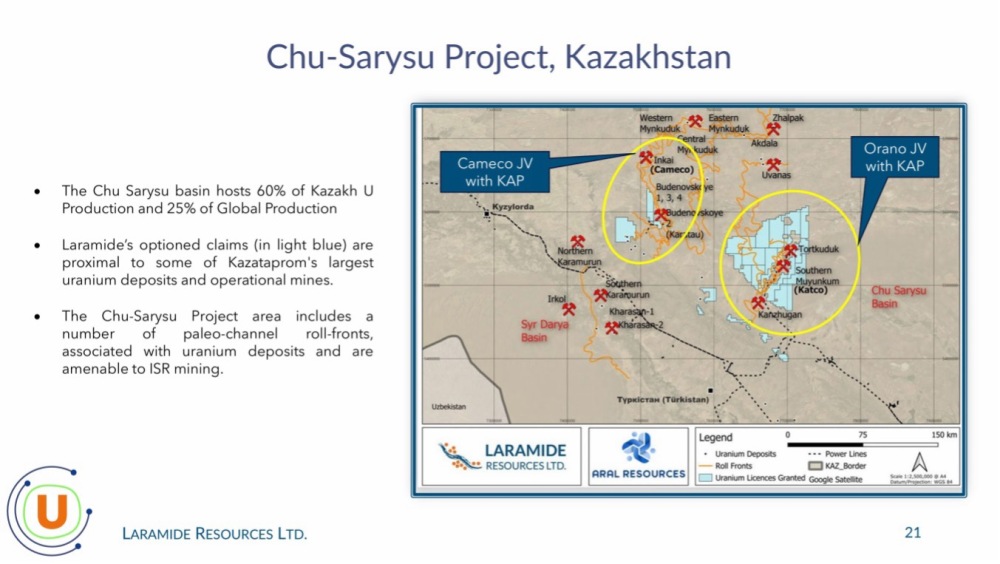
Meanwhile, in Kazakhstan, the company owns claims in the prolific Chu Sarysu basin which hosts 60% of Kazakhstan’s uranium production and an impressive 25% of global production…
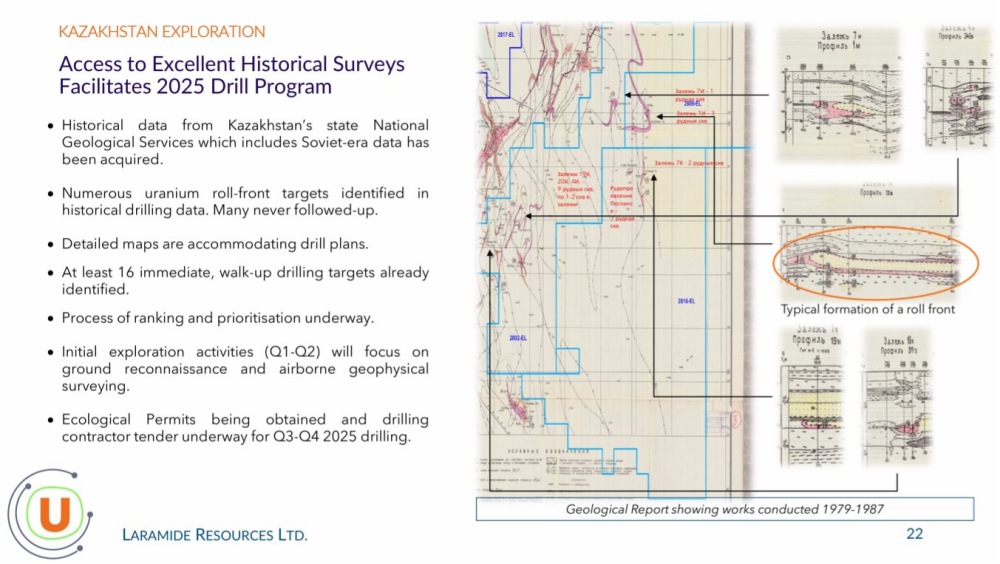
Plans for drilling at the Kazakhstan properties are already well-advanced…
Now to review the latest stock charts for Laramide Resources.
Laramide Resources has a long history and so it is necessary to look at a range of charts in order to gain a Big Picture perspective regarding what is going on the stock.
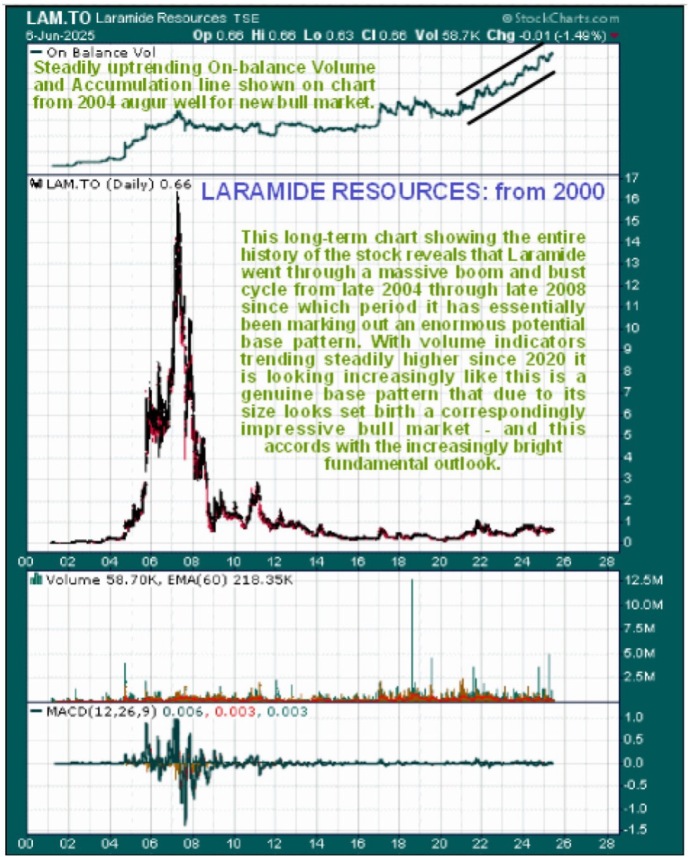
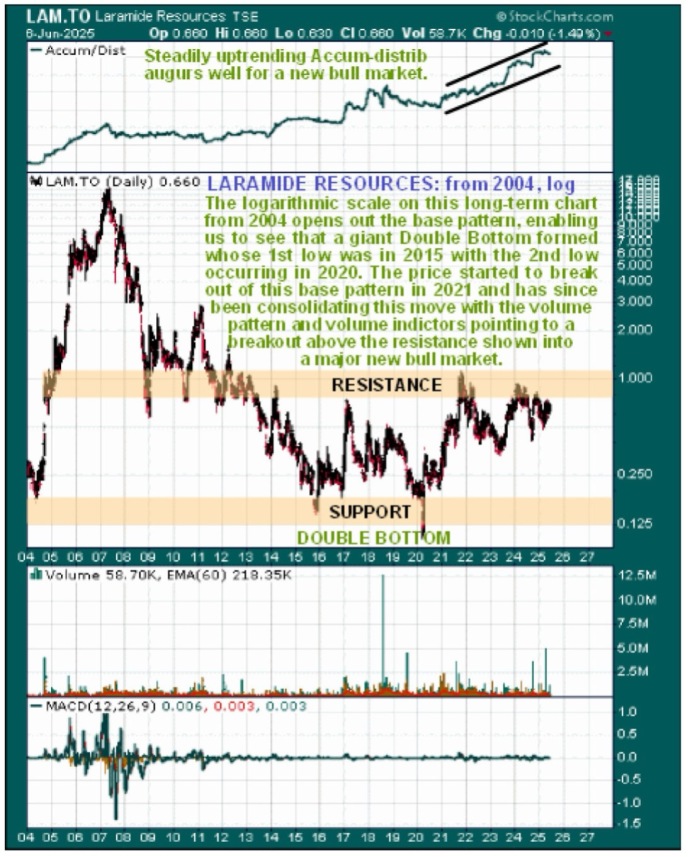
So we begin with a very long-term arithmetic-scaled chart going back to 2000 which shows the entire history of the stock. This shows that it went through a massive boom and bust cycle from late 2004 through late 2008, but after the initial bust into late 2008 a grinding bear market continued until the late 2015 low, although it did later make a lower low briefly at the time of the Covid Crash in the Spring of 2020. However, a basing process began as far back as 2012-2013 before it reached its lows, as we will shortly see as we move on to a log-scaled chart for a slightly shorter time period. Before leaving this chart, note the steadily uptrending On-balance Volume line from 2020, shown at the top of the chart, which strongly implies that a new bull market is incubating, especially as the Accumulation line is climbing in a like manner.
The long-term logarithmic-scaled chart from 2004 is very helpful as it “opens out” the base pattern, enabling us to see what is going on within it. The reason for pushing the start date of this chart forward to 2004 compared to the first chart is to knock out the low prices in the early 2000’s which would have the effect of pushing the base pattern visible up the chart so that it is not so clear. Here we see that a clear and giant Double Bottom has formed, whose first low was late in 2015 and whose second low was in the Spring of 2020 (the brief freak Covid Crash lows can be ignored). This Double Bottom was completed with the quite strong rally during 2021 that took the price up to the resistance shown at what can be considered to be the upper boundary of the pattern, since which time it has been consolidating. Although the price has not yet completed a clear breakout from this base pattern, the steadily uptrending Accumulation line shown at the top of this chart (and On-balance Volume shown on the last chart) is a strong sign that it is building up to doing so, and probably sooner rather than later.
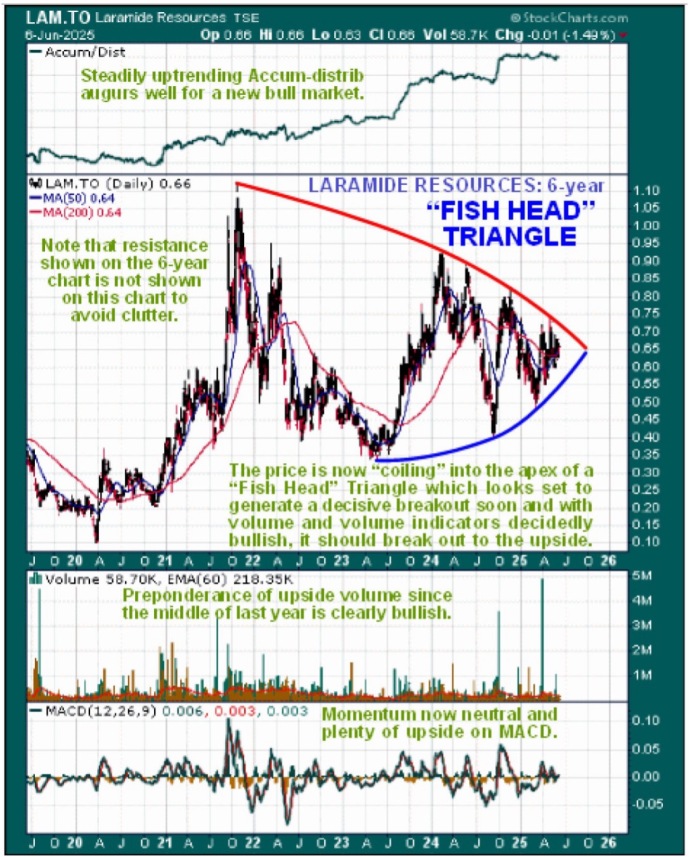
Moving on, we now zoom in on the consolidation pattern that has formed following the 2021 rally using a six-year. This chart allows us to see that this consolidation pattern has taken the form of a “Fish Head Triangle” which is a potent pattern because it involves the price “coiling” within Triangle boundaries that converge ever more rapidly. This generates compression that typically leads to a big move, and the strong upside volume over the past 10 months that has driven the Accumulation line steadily higher is a powerful indication that the breakout from the Fish Head Triangle will be to the upside. With the price pushing into the apex of the Triangle, breakout looks set to occur soon.
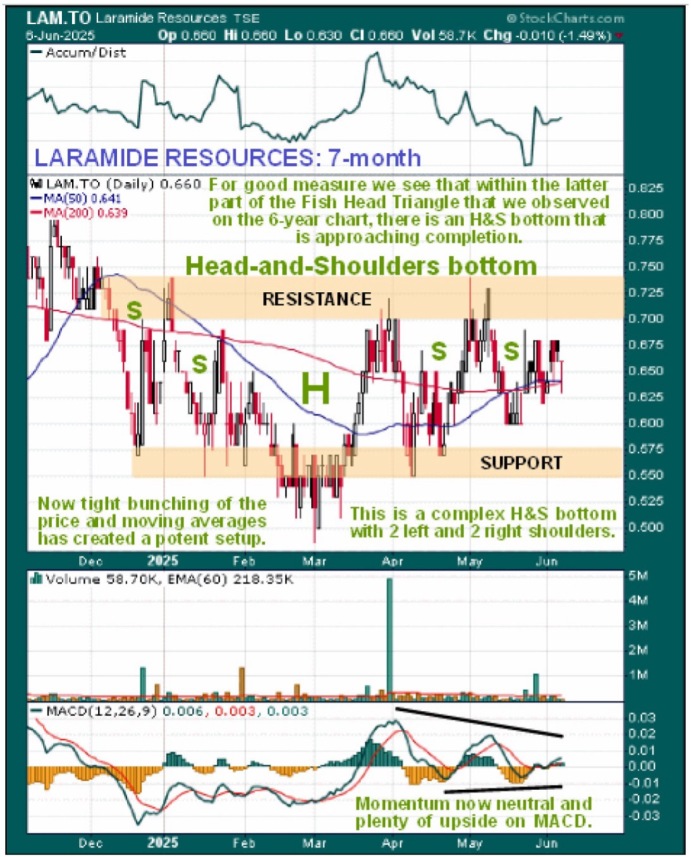
The fascinating charts for Laramide Resources have even more secrets to reveal for on the seven-month chart we see that the action as the price has pushed into the apex of the Triangle shown on the six-year chart constitutes a complex Head-and-Shoulders bottom that has two Left Shoulders and two Right Shoulders. This also promises an upside breakout and as the pattern looks complete such a breakout is likely to occur soon.
The conclusion therefore must be that, with an upside breakout looking set to occur soon that will lead to a substantial upleg, Laramide Resources is a strong buy here for all time horizons. In a very tight technical situation like this, an outside possibility that those interested in the stock should be aware of is that there could be a “head fake” false break lower from the Triangle that wrong foots a lot of people and is followed soon after by a possibly dramatic reversal to the upside. The first target for the expected new bull market is the CA$1.10 area at the top of the Triangle, the 2nd target is the resistance approaching CA$3.00 with much higher targets possible once this level is cleared.
There are 249.4 million shares in issue (266.2 million fully diluted) and the current market cap is CA$140 million.
Laramide Resources' web site.
Laramide Resources Ltd., LAM.TSX, C$0.66, LMRXF on OTC, $0.466, LAM.ASX, A$0.855, FRA: L4RA, June 9, 2025.
| Want to be the first to know about interesting Uranium investment ideas? Sign up to receive the FREE Streetwise Reports' newsletter. | Subscribe |
Important Disclosures:
-
For this article, the Company has paid Street Smart, an affiliate of Streetwise Reports, US$3,000.
- Author Certification and Compensation: [Clive Maund of clivemaund.com] was retained and compensated as an independent contractor by Street Smart to write this article. Mr. Maund is a technical analyst who analyzes historical trading data and he received his UK Technical Analysts’ Diploma in 1989. The recommendations and opinions expressed in this content reflect the personal, independent, and objective views of the author regarding any and all of the companies discussed. No part of the compensation received by the author was, is, or will be directly or indirectly tied to the specific recommendations or views expressed.
- Statements and opinions expressed are the opinions of the author and not of Streetwise Reports, Street Smart, or their officers. The author is wholly responsible for the accuracy of the statements. Streetwise Reports requires contributing authors to disclose any shareholdings in, or economic relationships with, companies that they write about. Any disclosures from the author can be found below. Streetwise Reports relies upon the authors to accurately provide this information and Streetwise Reports has no means of verifying its accuracy.
- This article does not constitute investment advice and is not a solicitation for any investment. Streetwise Reports does not render general or specific investment advice and the information on Streetwise Reports should not be considered a recommendation to buy or sell any security. Each reader is encouraged to consult with his or her personal financial adviser and perform their own comprehensive investment research. By opening this page, each reader accepts and agrees to Streetwise Reports' terms of use and full legal disclaimer. Streetwise Reports does not endorse or recommend the business, products, services, or securities of any company.
For additional disclosures, please click here.
Clivemaund.com Disclosures
The above represents the opinion and analysis of Mr. Maund, based on data available to him, at the time of writing. Mr. Maund's opinions are his own, and are not a recommendation or an offer to buy or sell securities. As trading and investing in any financial markets may involve serious risk of loss, Mr. Maund recommends that you consult with a qualified investment advisor, one licensed by appropriate regulatory agencies in your legal jurisdiction, and do your own due diligence and research when making any kind of a transaction with financial ramifications. Although a qualified and experienced stock market analyst, Clive Maund is not a Registered Securities Advisor. Therefore Mr. Maund's opinions on the market and stocks cannot be construed as a recommendation or solicitation to buy and sell securities.


