

Sun Summit Minerals Corp. (SMN:TSXV; SMREF:OTCQB) is regarded as an outstandingly attractive gold stock because the company is advancing two substantial gold projects in mining-friendly British Columbia, and it is in the "sweetest spot" of what is known as the Lassonde Curve.
Why?
Because the stock has not started to move yet, but looks like it is about to, and despite the current very low stock price, there is considered to be no chance of it "going bust." If there were, the recent significant funding would not have been expanded almost 3-fold due to strong investor demand.
Before looking at the latest stock charts, we will review the fundamentals of the company using pages from its latest investor deck.
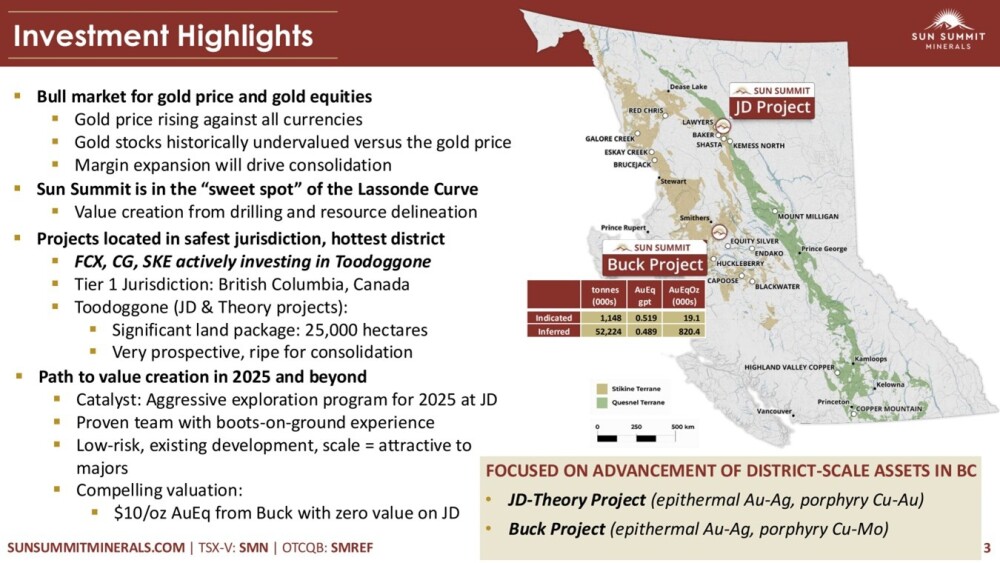
Sun Summit has two substantial, primarily copper / gold projects in British Columbia, the JD Project in north central BC and the Buck Project in central BC.
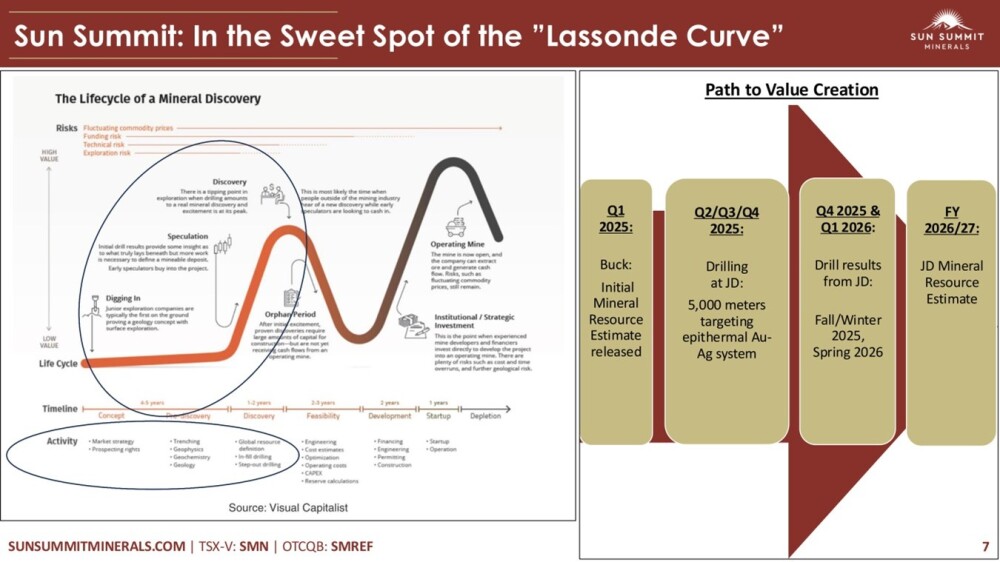
The following image details the highlights of the company and includes a map showing the locations of the projects.
The company presentation includes several very interesting pages, showing various macro factors that will create a very positive environment for mining companies such as Sun Summit going forward.
For instance, gold is in an ongoing powerful bull market that shows no sign of abating.
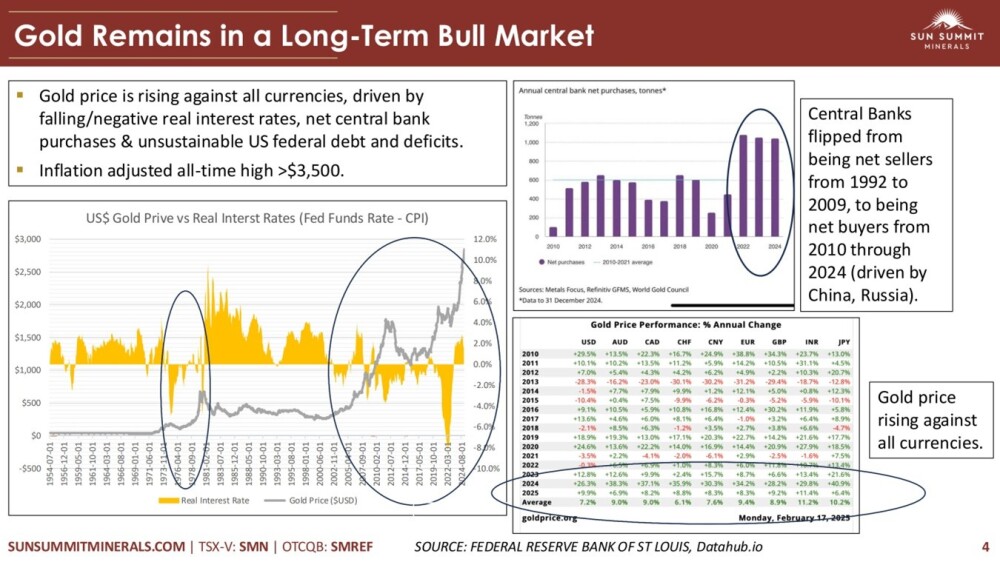
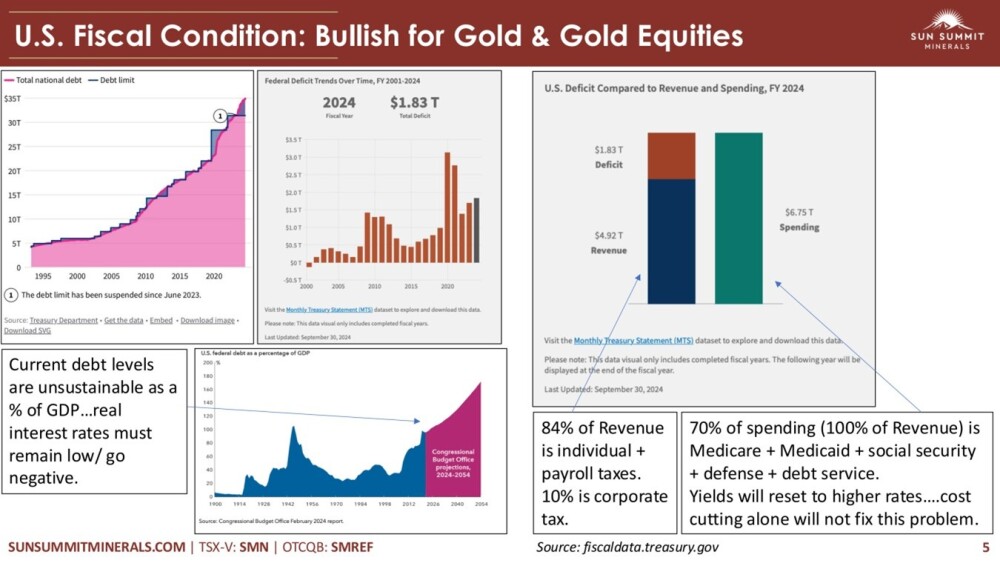
As we know, the out-of-control debt crisis is only set to get worse, which will make gold more and more attractive and continue to drive its price higher.
With gold, soaring gold stocks have a lot of catching up to do, especially as gold miners' profit margins are expanding nicely due to the continually expanding gap between the gold price and average AISC (all-in sustaining costs) of mining operations.
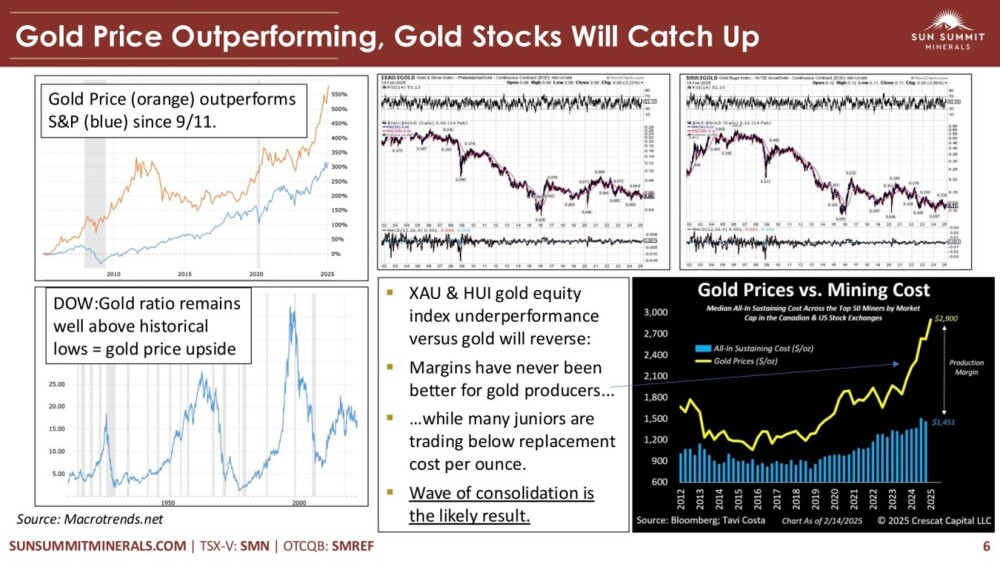
Sun Summit Minerals is definitely in the sweetest of sweet spots on the Lassonde Curve at its current price.
The JD Project is situated in a safe, mining-friendly, prolific jurisdiction in what is known as "The Golden Horseshoe" in BC, Canada.
This area has a similar geological environment to the Golden Triangle and is underexplored.
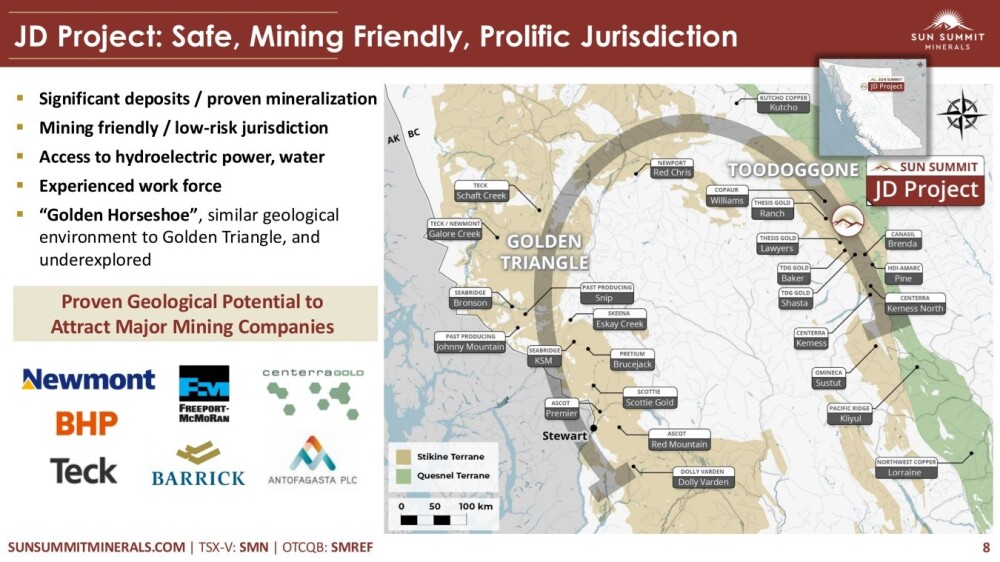
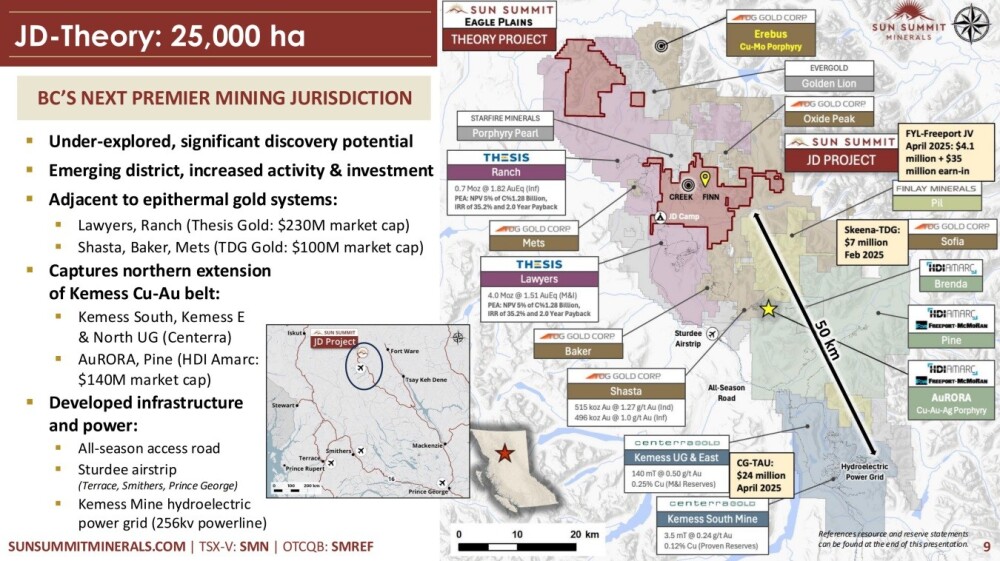
The JD Project is actually comprised of two land packages that are close to each other, the JD Project and the Theory Project.
Note the proximity of many other mining companies on the map on the following page, which is a clear indication of how rich this area is.
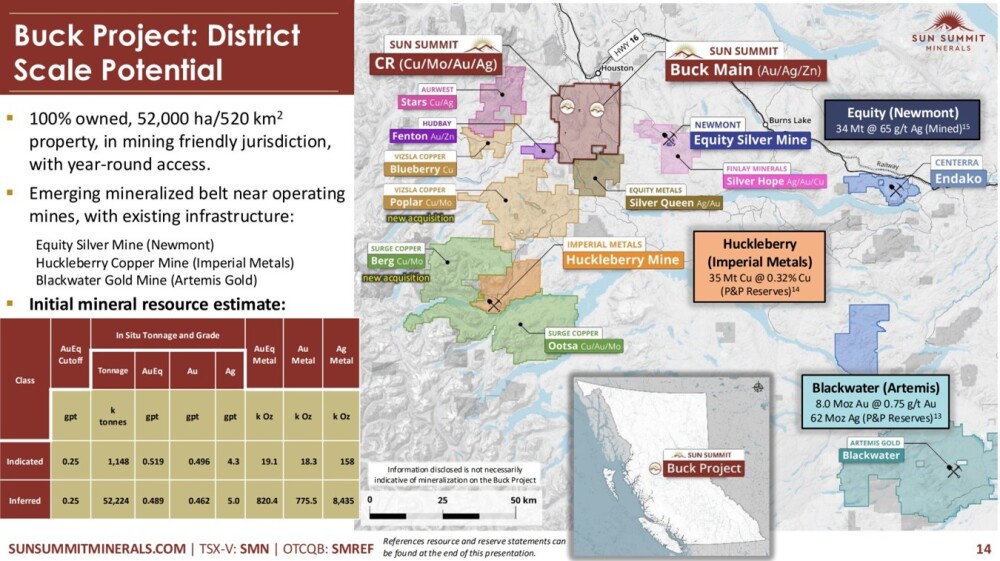
The other main project, the Buck Project, located in central BC, has district-scale potential.
The map below shows that it is also surrounded by other mining companies, a clear sign that this is a prolific area. This image also includes a table showing the initial MRE for Buck.
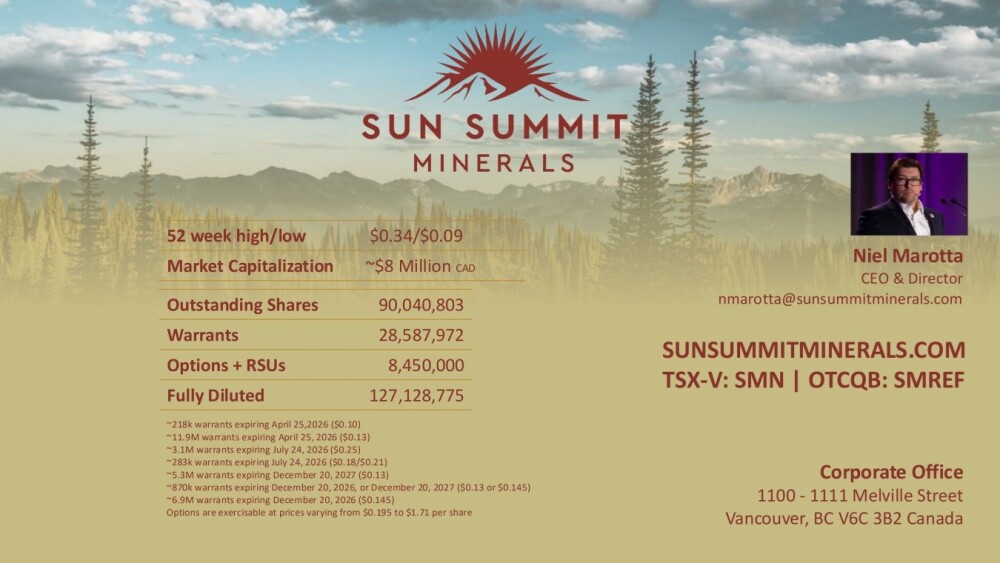
Lastly, this image from the deck shows the share structure.
The company still has a reasonable 90 million shares in issue (127.1 million fully diluted). Note: this is a pre-money share count. Thus, it will expand to over 200mm basic once the company closes on the $10mm+ financing.
For much more information on the geology of the properties, please refer to the investor deck.
Now, I will review the latest stock charts for Sun Summit.
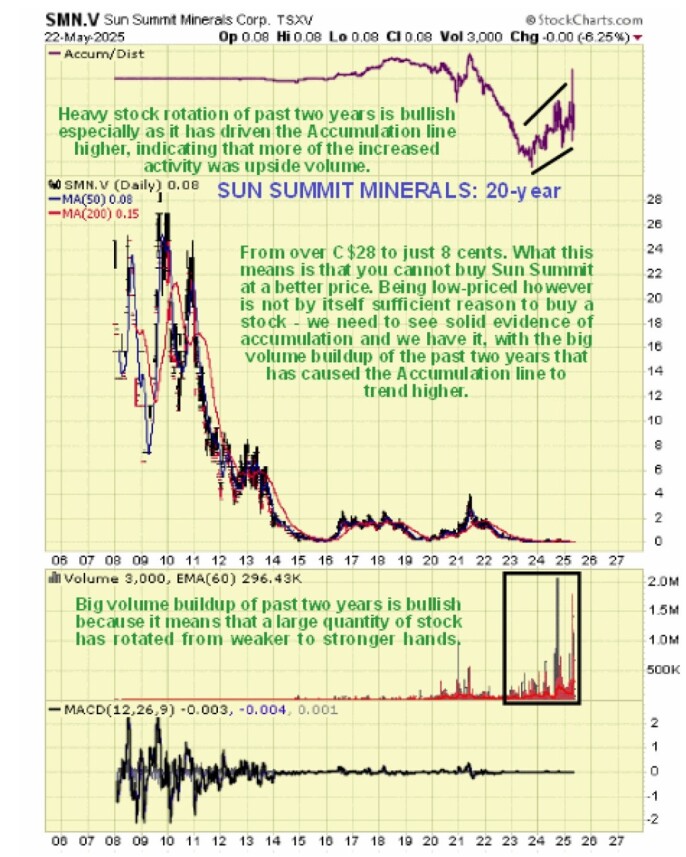
Technically, Sun Summit Minerals stock could not look more attractive than it is now. We will "break it down" by starting with its very long-term chart and zooming on the finer details.
The 20-year chart shows the entire history of the stock, and on it we can see that it is incredibly inexpensive here, given that it once traded at over CA$28 back in 2009 and is now priced at only CA$0.08. We can also see that it has been "bumping along the bottom" for over 10 years now, at times not far above 0 in fact, as is the case now, and given that we are now in a roaring gold bull market and that Sun Summit has "got the goods" with a strong gold component to its holdings, it is viewed as extraordinarily attractive here.
In addition, on this chart we can see that volume has ramped up very substantially over the past two years which means that a lot of stock has rotated from weaker to stronger hands, which is obvious as the sellers are for the most part stale old holders who are either taking a loss or getting out even, while the buyers see better times ahead and will not be inclined to sell until they have turned a profit. Most of this volume has been upside volume as is made clear from the uptrending Accumulation line shown at the top of the chart, which makes this volume buildup all the more bullish.
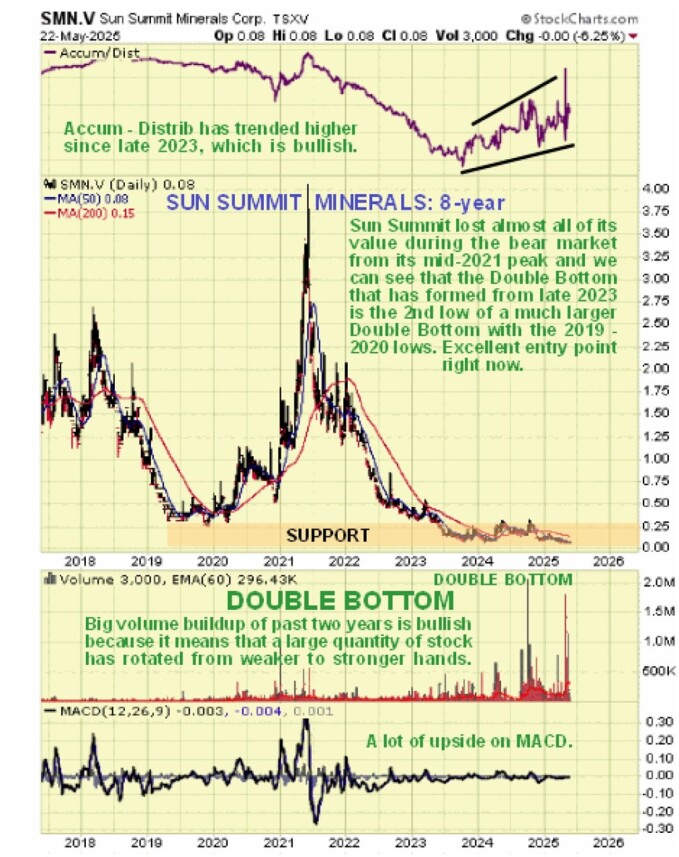
Zooming in, the 8-year chart shows the latter part of the potential giant base pattern that has formed since 2015. Here we see that the severe bear market from the mid-2021 peak erased most of the stock's value by the time it had run its course and we can also see that the low Double Bottom that has formed from late 2023 comprises the second low of a much larger Double Bottom with the 2019 – 2020 lows.
Again, we can observe, in more detail this time, how the Accumulation line has trended higher since late 2023 as the smaller Double Bottom has formed.
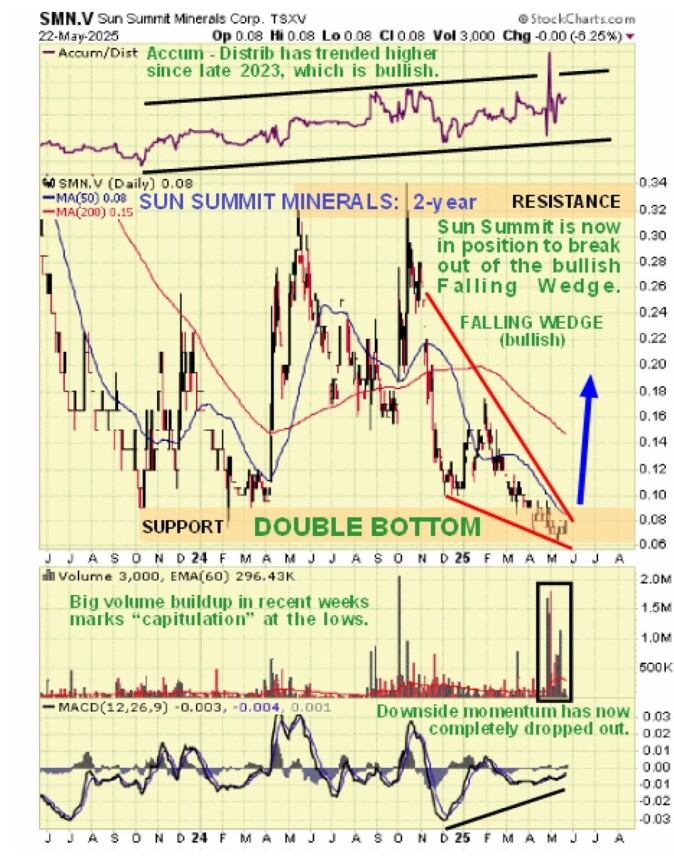
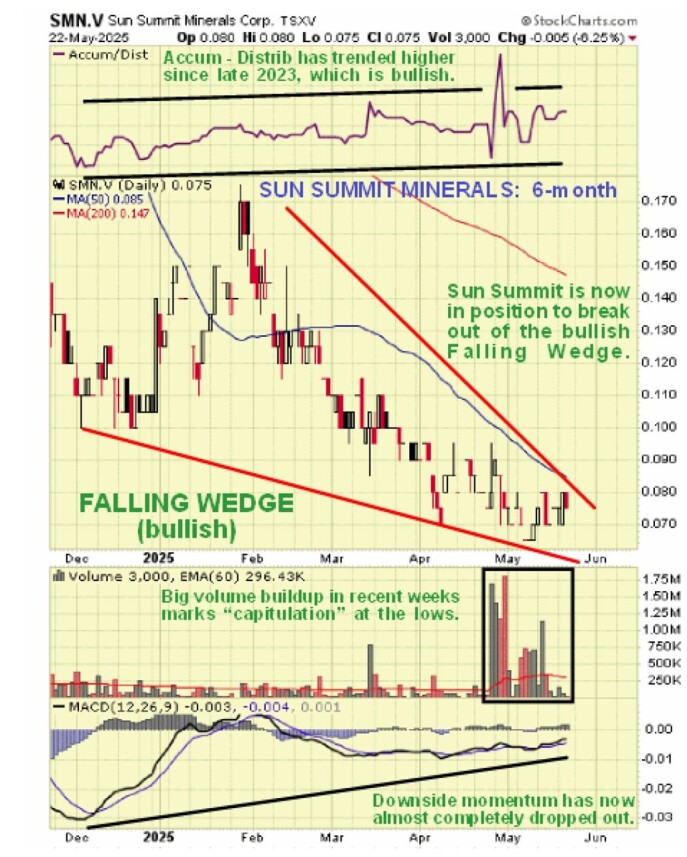
Zooming in again, the 2-year chart shows the Double Bottom that has formed over the past 18 months or so in much more detail. Here we see that the drop into the second low has taken the form of a Falling Wedge whose marked convergence is viewed as very bullish especially as there has been a big volume buildup in recent weeks as the price has squeezed into the apex of this Wedge which shows "capitulation" — the final dumping of stock by weak holders before a reversal to the upside.
Note also how downside momentum (MACD) has dropped out completely in recent weeks as the price has come to the end of the Wedge, setting the stage for a breakout.
Lastly, the 6-month chart shows recent action in more detail.
Observe how downside volume has dropped out completely and with volume now very light, the stock is believed to be poised for a breakout very soon.
The conclusion must be that Sun Summit Minerals could not be more attractive than it is now, with the potential not just for large nominal gains soon, but for big percentage gains in short order from the current very low price, and it is therefore rated an Immediate Strong Buy for all time horizons.
The first target for an advance is the CA$0.32 – CA$0.34 area. The second target is the CA$2.00 – CA$2.50 area, with a third target at CA$4.00 and higher targets beyond that.
Sun Summit Minerals' website.
Sun Summit Minerals Corp. (SMN:TSXV; SMREF:OTCQB) closed for trading at CA$0.07, US$0.0581 on May 22, 2025.
| Want to be the first to know about interesting Gold and Critical Metals investment ideas? Sign up to receive the FREE Streetwise Reports' newsletter. | Subscribe |
Important Disclosures:
- For this article, the Company has paid Street Smart, an affiliate of Streetwise Reports, US$3,000.
- Author Certification and Compensation: [Clive Maund of clivemaund.com] was retained and compensated as an independent contractor by Street Smart to write this article. Mr. Maund is a technical analyst who analyzes historical trading data and he received his UK Technical Analysts’ Diploma in 1989. The recommendations and opinions expressed in this content reflect the personal, independent, and objective views of the author regarding any and all of the companies discussed. No part of the compensation received by the author was, is, or will be directly or indirectly tied to the specific recommendations or views expressed.
- Statements and opinions expressed are the opinions of the author and not of Streetwise Reports, Street Smart, or their officers. The author is wholly responsible for the accuracy of the statements. Streetwise Reports requires contributing authors to disclose any shareholdings in, or economic relationships with, companies that they write about. Any disclosures from the author can be found below. Streetwise Reports relies upon the authors to accurately provide this information and Streetwise Reports has no means of verifying its accuracy.
- This article does not constitute investment advice and is not a solicitation for any investment. Streetwise Reports does not render general or specific investment advice and the information on Streetwise Reports should not be considered a recommendation to buy or sell any security. Each reader is encouraged to consult with his or her personal financial adviser and perform their own comprehensive investment research. By opening this page, each reader accepts and agrees to Streetwise Reports' terms of use and full legal disclaimer. Streetwise Reports does not endorse or recommend the business, products, services, or securities of any company.
For additional disclosures, please click here.
Clivemaund.com Disclosures
The above represents the opinion and analysis of Mr. Maund, based on data available to him, at the time of writing. Mr. Maund's opinions are his own, and are not a recommendation or an offer to buy or sell securities. As trading and investing in any financial markets may involve serious risk of loss, Mr. Maund recommends that you consult with a qualified investment advisor, one licensed by appropriate regulatory agencies in your legal jurisdiction, and do your own due diligence and research when making any kind of a transaction with financial ramifications. Although a qualified and experienced stock market analyst, Clive Maund is not a Registered Securities Advisor. Therefore Mr. Maund's opinions on the market and stocks cannot be construed as a recommendation or solicitation to buy and sell securities.


