

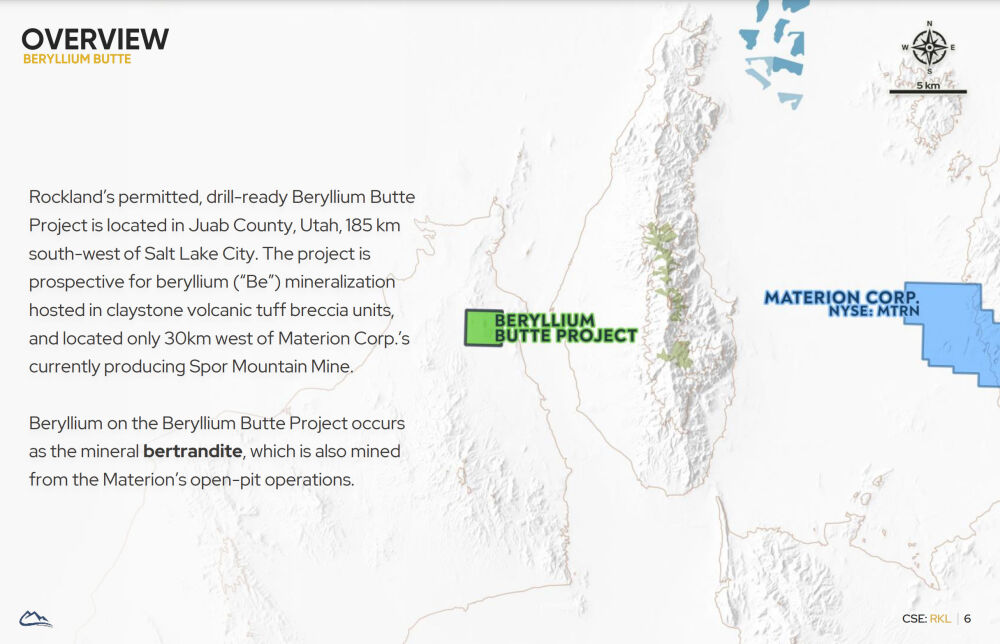
Rockland Resources Ltd. (RKL:CNSX) is an intriguing speculative play here. The company is exploring the lightweight metal Beryllium in the State of Utah in a place where it is likely to find it since the location where it is looking for it is in close proximity to the world's biggest beryllium producer, $2.1 billion market cap Materion Corp. (MTRN:NYSE).
The reason why we are focusing on it here is because it is at a very low price following a severe bear market and a period of base building, with it looking like it will soon advance out of the base pattern that has built out this year. The company also now owns 100 per cent of the Cole Gold Mines property, which hosts high-grade gold mineralization in a classic Red Lake-type structurally controlled gold deposit environment.
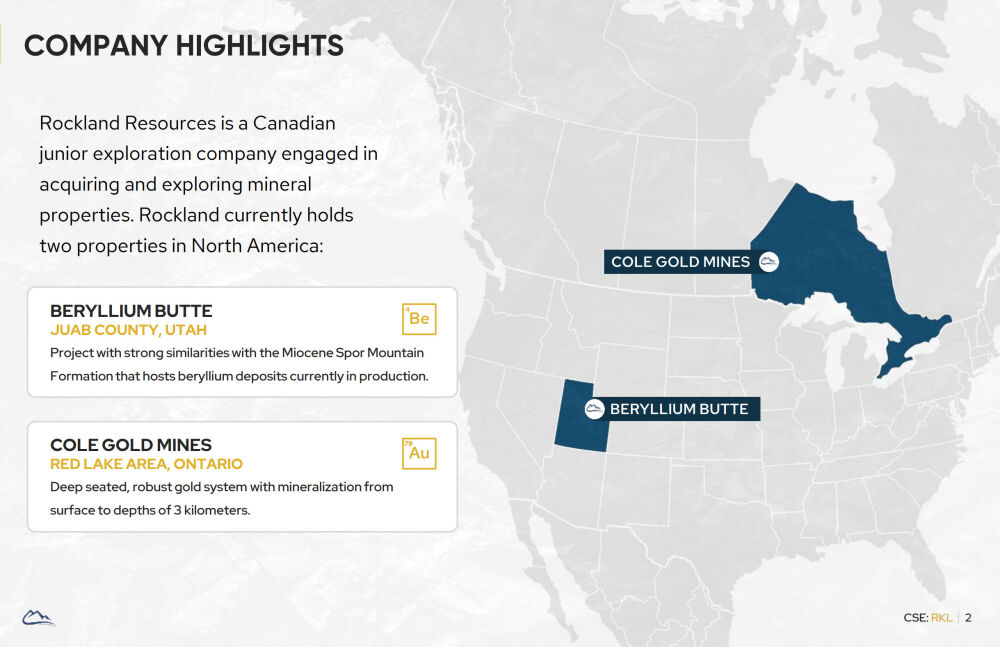
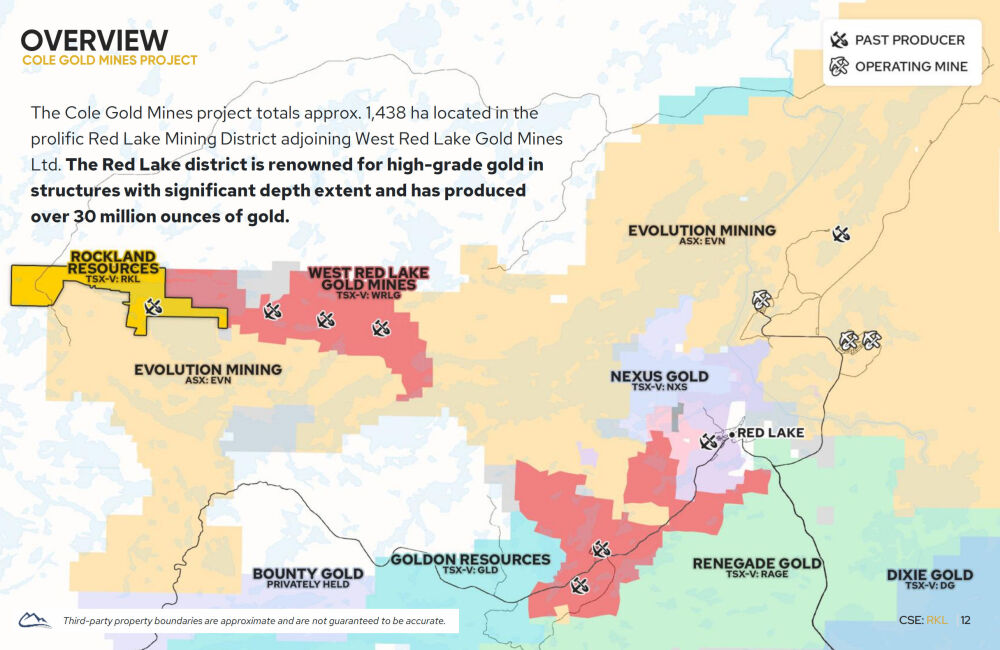
The following map taken from the company's latest Investor Deck shows the locations of the company's two properties, the Beryllium Butte Project in Utah and the Cole Gold Mines Project in Ontario.
Before going any further, it should be pointed out that this is a very low-priced speculative stock that is not suited to all investors /subscribers. A wealth of big gold and big silver stocks were covered in the Big Golds Review, and the Big Silvers Review posted some weeks ago, and they have since done well, although they are taking a hit today. Rockland Resources is at the other end of the scale to these large stocks, and while you should not invest money in this that you can't afford to lose, that said, there is thought to be a good chance that it will do well and it is certainly considered to be a worthy addition to a basket of junior mining stocks.
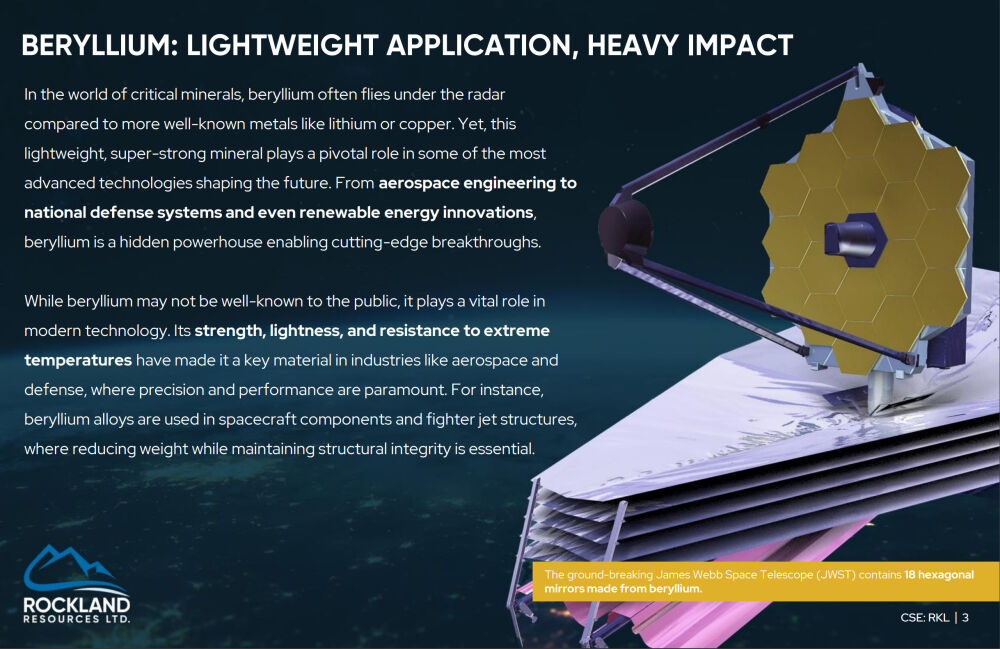
Here is a brief description of Beryllium: Despite its obscurity, beryllium's unique properties make it indispensable in industries demanding high-performance materials. This lightweight yet incredibly strong metal is revolutionizing aerospace, powering the next generation of small nuclear reactors, and enabling groundbreaking advancements in defense technologies. As these sectors continue to expand, especially with the rise of green technologies and geopolitical shifts, beryllium is poised to become increasingly valuable. For investors seeking to tap into critical minerals with long-term potential, beryllium represents an overlooked but highly strategic opportunity.
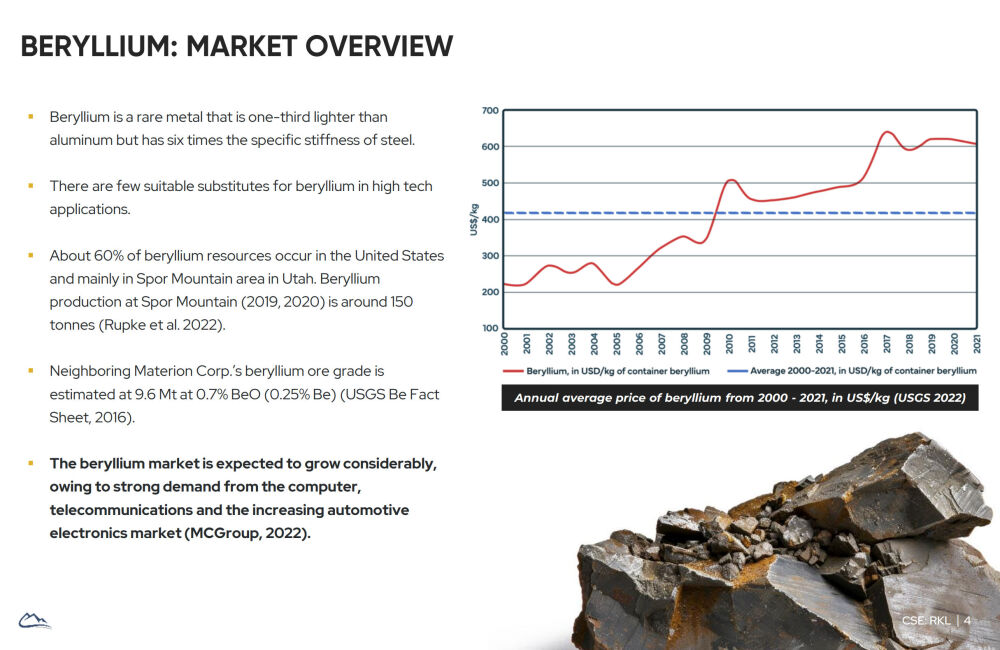
More on Beryllium, including a chart that shows its price trending higher for many years.
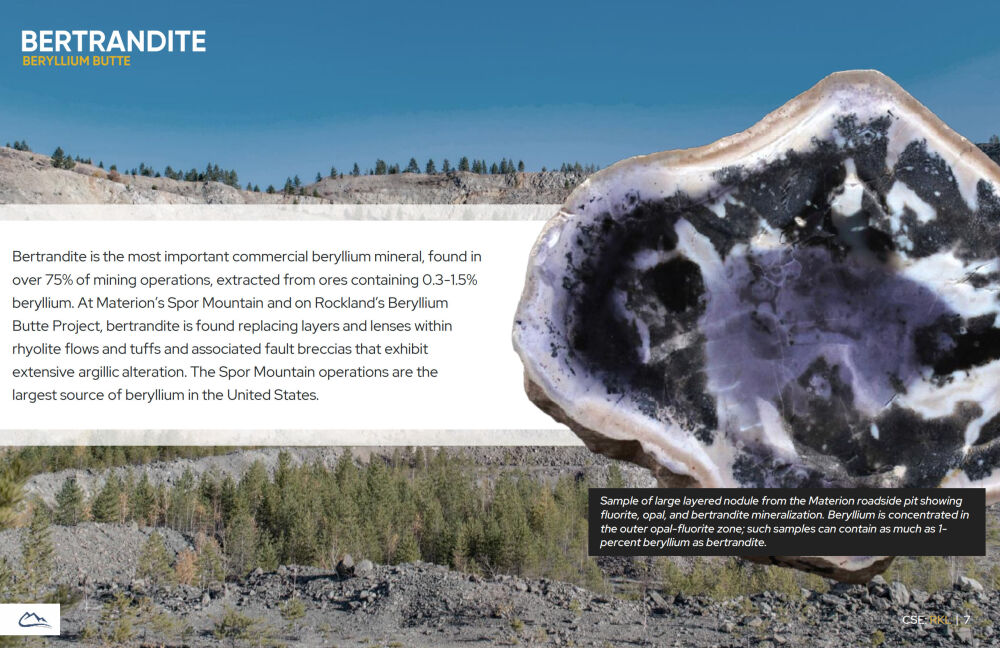
Beryllium is extracted from the mineral Bertrandite.
It is understood that Rockland is undertaking a modest private placement in order to fund a drilling program at its 100% owned Beryllium Butte Project that should get underway in a few weeks.
However, this funding should not constrain the stock price any further because, with the stock already in the 3-cent area, it is factored in. Each 3-cent share comes with a full 3-year warrant at 5 cents. The following map shows that the Beryllium Butte Project is not far away from the world's biggest beryllium producer, $2.1 billion market cap Materion Corp.
The company's other project, the Cole Gold Mines Project in Ontario, is an impressive 1438 hectares in extent, made even more impressive by the fact that it is in a prolific gold trend and as we can see on the following map, it is in good company with Evolution Mining and West Red Lake Gold Mines as immediate neighbors.
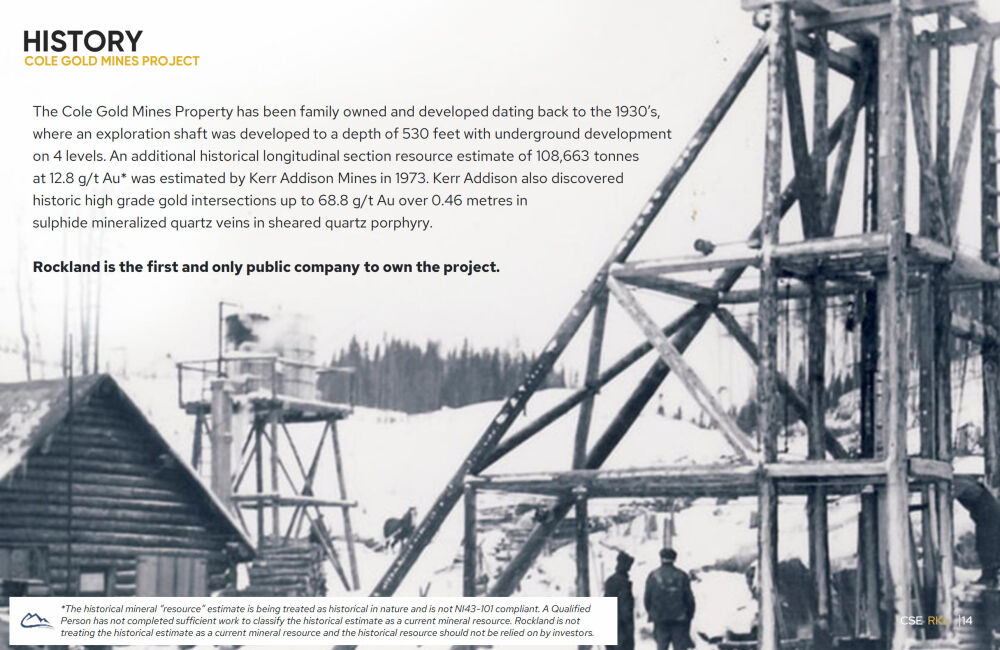
For history buffs amongst you, here is something on the history of Cole Gold Mines that has relevance today, given what was found there in the old days.
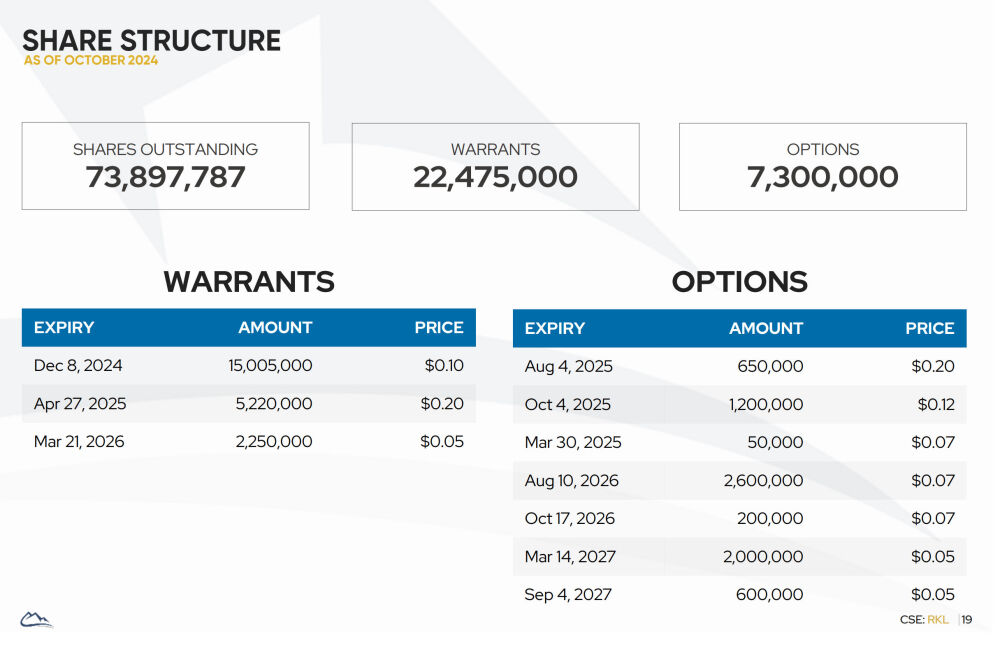
Lastly, this page shows the share structure.
For reasons of space and page load time, slides showing details of Exploration Budgets, Geology, Management etc are not included but you can view these details by going to the company's latest Investor Deck.
Turning now to the charts for Rockland and starting with the long-term 54-month (4-year 6-month) chart, we see that it has suffered a long and severe bear market from its highs in 2021 at C$0.28 that brought it all the way down to a low at just 1.5 cents in February – March when it petered out with a base pattern developing this year. Even on this chart, we can see that the base pattern that has formed is a Double Bottom whose duration has allowed downside momentum (MACD) to complete dropping out so that momentum looks set to turn positive and Accum – Distrib looks decidedly positive even if the freak spike in this can be ignored as it appears to have been due to a large “cross” trade.
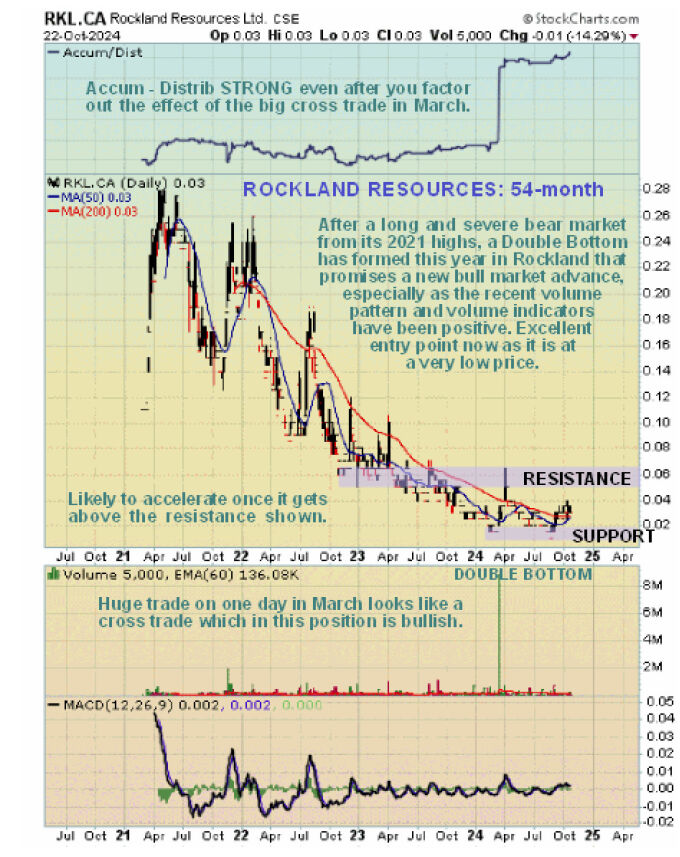
On the 1-year chart we can see the Double Bottom in much more detail and how its two lows are at the same level, which makes it more likely that the pattern is genuine. We can also see how the advance out of its 2nd low in September looks like the first tentative upwave of a new bull market and how any further progress will quickly result in a bullish cross of the moving averages which will be the first time this has occurred since the start of 2022 (which happened to be a false signal).
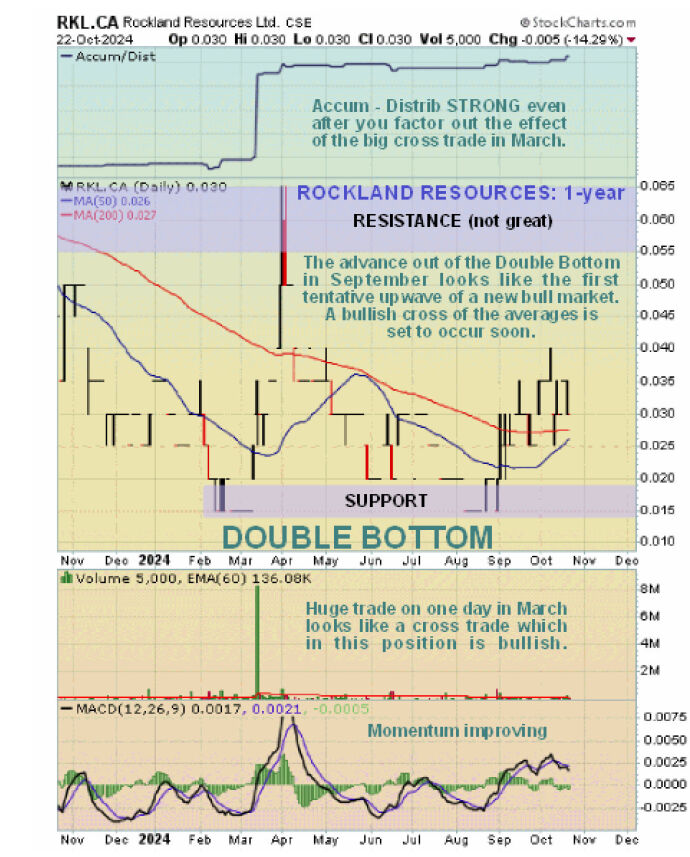
The conclusion is that, whilst recognizing that it is a speculative play, this looks like a very good price area to accumulate Rockland Resources and with drilling probably set to commence in a few weeks time, you may not have to wait long to see a return on your investment.
Rockland Resources website
Rockland Resources Ltd. (RKL:CNSX) Note that although the charts are for the close of trading on 22nd, it doesn't matter because the price was unchanged today.
| Want to be the first to know about interesting Gold investment ideas? Sign up to receive the FREE Streetwise Reports' newsletter. | Subscribe |


